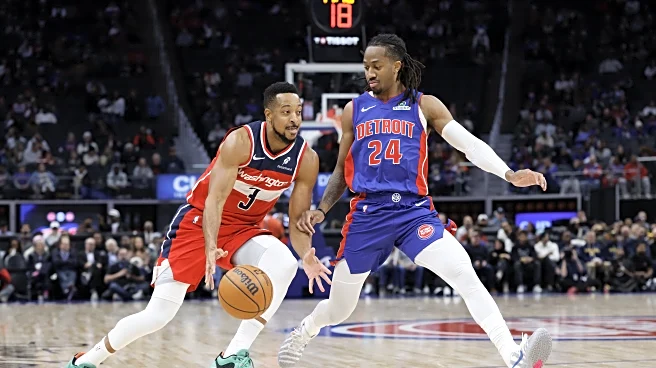
For much of the fourth quarter, it looked like the Wizards were going to secure their second win of the season. When they were up 10 with five minutes on the clock, I thought of what I thought could be
a clever lead to this article, which may now never see the light of day because they squandered that lead and lost.
It was only a maybe 90 seconds of game clock after I thought of that lead that I actually thought the Wizards would lose. They were still up seven with under four minutes, and I wondered aloud to the empty room, “Why are they dribbling down the shot clock? They’re only up seven.”
Naturally, this was being done by the savvy veterans, CJ McCollum and Khris Middleton, who are on hand to teach The Right Way. Except, you can’t run a Riggo Drill in basketball because of the shot clock. Basically, wasting time with a small lead and three-plus minutes on the clock means you’re likely to get a worse shot, which lowers your odds of scoring, which increases the other team’s chances of coming back.
And that’s what happened.
To be fair, while I think the late-game strategy was suboptimal, that wasn’t what sent the game to overtime and cost Washington the win. The Wizards were done in by giving up 28 offensive rebounds (not a typo) — the second time in three games an opponent had an offensive rebounding percentage above 40% (Detroit’s was 44.4% — again, not a typo).
The Pistons also won the turnover battle (14 turnovers to Washington’s 20) and made 10 more free throws because of Washington’s excessive hacking and swiping. Kyshawn George, Alex Sarr, and Bub Carrington each committed five fouls. Middleton had four. McCollum and Cam Whitmore had three each.
Detroit’s significant edge in three of the four factors enabled them to win despite the Wizards posting an effective field goal percentage of 60.5% compared to the Pistons’ atrocious 46.9%. The team that shoots better wins about 80% of the time in the NBA. Not last night. Not when you give up 28 offensive rebounds, commit lots of fouls, and burn 20 possessions on turnovers.
Thoughts & Observations
- The Peacock broadcast was excellent. I liked the analysts (Robbie Hummel and Austin Rivers) situated on each team’s bench, which gave them insights into what coaches were saying and strategizing. Good stuff, that I hope every team’s broadcast copies. This was also a great use of ex-players.
- At the 4:27 mark of the fourth quarter, Detroit’s Cade Cunningham attacked in transition and got knocked to the floor by Cam Whitmore, who then earned a (deserved) technical foul by standing over him and seeming to gloat. Refs reviewed for a potential flagrant, which they did not call — they left it as a hard but common foul. And then, Brian Keefe came in off the top rope and challenged the foul call on Whitmore. And while the refs upheld their foul call, I think Keefe and the Wizards coaching staff had a point. Whitmore got ball. Yes, some off hand, but not a lot. And in theory, they could’ve even called Cunningham for trying to use the off hand to ward off the block attempt. In the end, it goes into history as a hard foul. I don’t love that Cunningham fell so hard, but I do like the effort and athleticism from Whitmore, and Keefe backing up his player in that situation.
- McCollum’s slow start is gone. He lit up the Pistons en route to 42 points on just 25 shots.
- Cunningham set a Pistons record with 45 field goal attempts. He set the record in regulation and extended it in overtime. He finished the game with a triple-double — 46 points, 12 rebounds, 11 assists. His shooting stunk (just 14-45), but his five offensive rebounds, and assists without turnovers boosted his offensive rating to a decent (but still below average) 110 on a 43.5% usage rate.
- Daniss Jenkins, who’s on a two-way contract with the Pistons, entered the game with a career high of nine points. He went home with a new high: 24 points, including a fourth-quarter buzzer-beater to send the game into overtime. The diminutive Jenkins (listed a 6-3, but c’mon) added 8 rebounds, 3 assists, 4 steals, and what seemed like every hustle play. Kudos.
Four Factors
Below are the four factors that decide wins and losses in basketball — shooting (efg), rebounding (offensive rebounds), ball handling (turnovers), fouling (free throws made).
The four factors are measured by:
- eFG% (effective field goal percentage, which accounts for the three-point shot)
- OREB% (offensive rebound percentage)
- TOV% (turnover percentage — turnovers divided by possessions)
- FTM/FGA (free throws made divided by field goal attempts)
In the table below are the four factors using the percentages and rates traditionally presented.
Stats & Metrics
PPA is my overall production metric, which credits players for things they do that help a team win (scoring, rebounding, playmaking, defending) and dings them for things that hurt (missed shots, turnovers, bad defense, fouls).
PPA is a per possession metric designed for larger data sets. In small sample sizes, the numbers can get weird. In PPA, 100 is average, higher is better and replacement level is 45. For a single game, replacement level isn’t much use, and I reiterate the caution about small samples sometimes producing weird results.
POSS is the number of possessions each player was on the floor in this game.
ORTG = offensive rating, which is points produced per individual possessions x 100. League average so far this season is 115.1. Points produced is not the same as points scored. It includes the value of assists and offensive rebounds, as well as sharing credit when receiving an assist.
USG = offensive usage rate. Average is 20%.
ORTG and USG are versions of stats created by former Wizards assistant coach Dean Oliver and modified by me. ORTG is an efficiency measure that accounts for the value of shooting, offensive rebounds, assists and turnovers. USG includes shooting from the floor and free throw line, offensive rebounds, assists and turnovers.
+PTS = “Plus Points” is a measure of the points gained or lost by each player based on their efficiency in this game compared to league average efficiency on the same number of possessions. A player with an offensive rating (points produced per possession x 100) of 100 who uses 20 possessions would produce 20 points. If the league average efficiency is 114, the league — on average — would produced 22.8 points in the same 20 possessions. So, the player in this hypothetical would have a +PTS score of -2.8.
Players are sorted by total production in the game.


