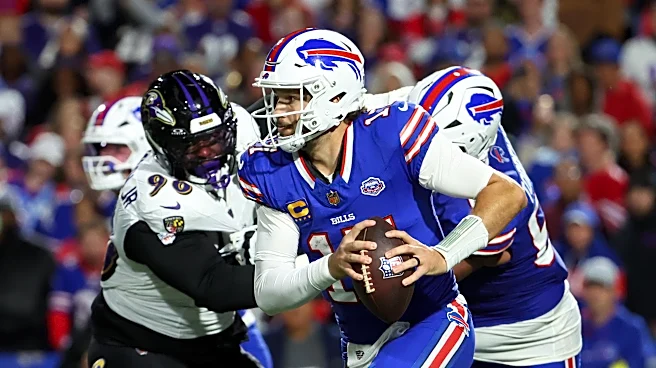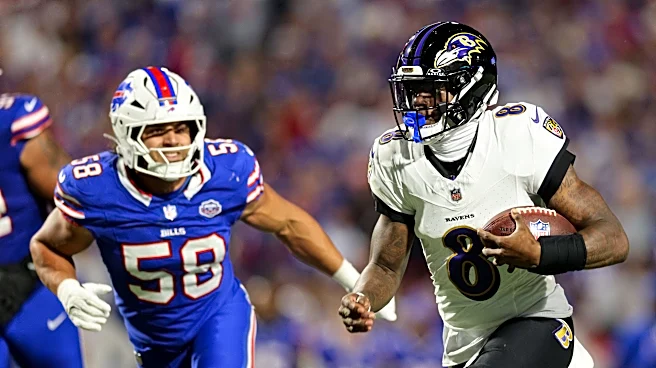



If you’re on social media for the Buffalo Bills you’ve likely seen the same graphic I have. The Buffalo Bills have won about 42 games when allowing the other team to score eighty zillion points or so, while understandably most teams struggle when giving up eighty zillion points or so. The conclusion is supposed to be simple: Josh Allen and the Buffalo Bills offense are really, really good.
It’s a metric meant to show that the Bills are winning shootouts. While that’s fun, it wasn’t so long ago that we
were enjoying blowouts. So that begs the question, is this the worst defense Josh Allen has had to support him?
Well? Is it?
But first, some methodology
I’m going to attack this from a couple different ways. The first and easiest is points per drive. Note that all metrics used are rate states with an emphasis on per drive metrics. You can blame Matt Warren for getting me fixated on a drive = opportunity; which is a near perfect unit of “what do you do when given a chance?”
Anyway, the simple analysis will be points per drive as that’s sort of the mission for defenses; to prevent points. That said, I will also do a more complex analysis using seven metrics that I think are good measures of defensive performance. Soon you’ll see a table which has the Bills’ rate in each metric and league ranking with #1 being the best of course. That allowed me to create a total score to weigh defenses against each other (lowest score is best).
Here are the metrics and rationale (I don’t claim this to be perfect, so feel free to use it as a launch pad for success):
- Pts/drive – Included for obvious reasons.
- Yards/drive – Included as a metric for how advantageously they help put Allen into position. The shorter the distance given up, the less room Allen needs to score.
- Time/drive – Similar to yards per drive. The more time you put Allen out there, the better.
- Score % – This is like looking at a failure rate. Some overlap with pts/drive but not entirely. Pts/drive factors in type of score whereas this metric is more about “did we get a stop?”
- Turnover % – This would be a type of success rate but not a complete one. It’s included to show capability to force a drive to end.
- Sack % – Included just because it’s fun. OK, maybe it’s included because this could be tied to capability to rattle the opposing offense and create opportunities.
- 3rd down % – Included as a sort of “clutch” metric. How often can you get a stop when the stop is right in front of you?
One last quick thing when you see the chart. I did a heat map based on my rule of four metrics (top four teams are elite, next four are good, the middle 16 are average, then a group of four that are bad, and the last four are labeled as “terrible”).
The Chart

Well, that sure was easy. Either way you slice it, this year’s defense is comfortably the worst that Josh Allen has ever been paired with. Using our simple metric of points per drive, Josh Allen has never been on a team giving up more. Their worst finish prior to this was 18th which is thoroughly average.
When we get to our more complex rating system, the heat map tells us right away we have a problem. Only in one metric are the Bills even average (turnover rate). And even in THAT metric, it’s still their worst rating in the Allen era. As a matter of fact, it doesn’t matter which metric you pick out of these seven, the 2026 season if it holds true will be the worst in all of them.
Now, I want to try to dismiss any claims of cherry picking. I chose the categories first as I felt they covered a broad swath of areas and was honestly not expecting this clear of a picture. I’m also aware of metrics where they aren’t the worst, like rushing yards per attempt. I didn’t isolate yards by type for this as I felt it was too granular but want to acknowledge the 2026 Bills are NOT worst at everything, but they’re significantly worse in many major metrics. And again, points per drive is atrocious.
I can keep rubbing salt in the wounds like pointing out how Greg Rousseau had been leading the league in sacks for a bit and is still third in the league. I’m glad he’s doing well, but the team really isn’t on sack rate.
I could go on. And on. The chart really covers most of it pretty well though. I’ll note the ranking system/score has some flaws but I stand by it as a quick way to aggregate and compare. It helps show just how dominant the 2021 defense was. It’s incredible the Bills didn’t win the big one that year as it was also one of Allen’s best seasons.
So what the hell happened, man? In a word? Volatility. Overall, this defense was insanely good, but they weren’t as steady as the averages suggest. They had 11 games allowing less than 20 points, including five at ten or under which had two shutouts. They also had four games allowing more than 30, including their loss in the Divisional Round.
What about the other years when we look at it through this lens? Well 2018 and 2019 had average to bad Allen and the offensive firepower wasn’t there (notably not even making the playoffs in 2019). 2020 was Allen’s breakout season and again the word “volatility” comes up again. I would also note that by my scoring metric it was the second worst defense Allen had with Sean McDermott.
In 2022 I would also use that word, but I would also point out that while the team’s eventual loss to the Bengals had a very shaky start to the game on defense, the offense was zero help for much of the game. The Bills gave up 27 which also doesn’t qualify as an epic collapse either. In 2023, they again lost a game by giving up 27 points, meaning the loss wasn’t entirely on the defense. These were both years with what appear to be very good defenses still and so some disappointment is justified.
The 2024 season was the worst Sean McDermott defense Allen was paired with and it was the reason for their loss to KC. In 2025 the defense improved but was still the third worst for McDermott with Allen. The 33 points looks like a defensive collapse, but I would remind everyone that the Bills gave the ball away faster than Halloween Candy that game.
It’s always a good idea to come back to the idea of volatility. I’d remind anyone still reading this far that yes, the defense has disappointed in some playoffs losses, but they’ve also been dominant in many playoffs wins. It’s frankly one of the laziest arguments in my opinion to blame the McDermott defense for the playoff failures. It’s a mixed bag.
Now, am I trying to disguise this article as a way to show love for McDermott? Not at all. While I think he did a fantastic job and that his defenses get some very weird ire not supported by the evidence, I was OK with moving on. His defenses were generally quite good to elite, though imperfect for sure. The heat map also shows a pattern of decline. That could be a Brandon Beane conversation too if you want.
No, the article is intended to just simply state one simple fact. If the Bills are going to win it all this year, they’ll need to do so despite the defense unless they hit some stride they’ve shown no evidence of having in them. I hope it happens, but this far into the season it’s hard to be confident with that.
I do have one more thing for everyone though.

This is the same chart, but with Sean McDermott’s first year thrown in, pre-Josh Allen. This year’s defense is still worse, but it’s not by remotely as much as any other McDermott year. Why does this matter? First, it’s natural to think something would move backward with a new coaching staff. Second, the Bills squeaked into the playoffs that year and held a red hot Jacksonville Jaguars team to ten points in the Wild Card round.
That was also the year where McDermott pulled the plug on the Marcell Dareus extended audition mid-year which had the immediate impact of allowing the Bills to get their butts kicked for a bit while they sorted things out. That became the dawn of the Buffalo Nickel defense which transitioned into the elite years as shown on the chart.
In other words, there’s time to turn it around and peak at the right time. Those Buffalo Bills lost because they couldn’t score more than the Jaguars’ 10, managing only a field goal to be precise. I like Allen’s odds in that situation.
Josh Allen is paired with the worst defense of his career…
So far.