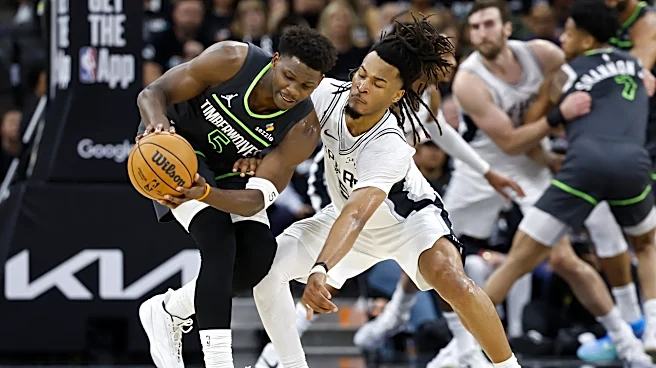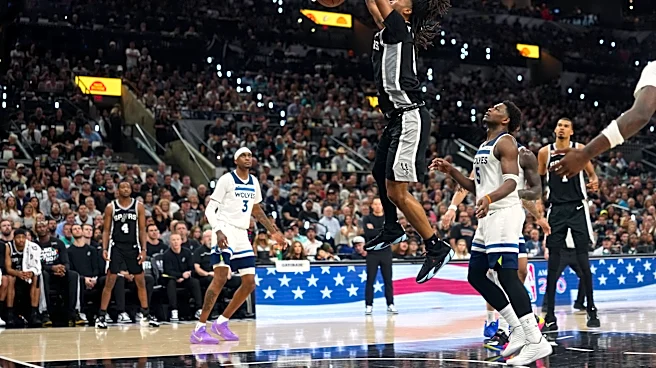


Aside from an increasingly irritating stretch of play that ran from roughly three minutes into the second quarter through the first five minutes of the third (during which the Spurs’ 18-point lead evaporated to zero), this game was exactly the tonic I was hoping for. First, Wemby’s return was triumphant, which provided a much needed sign that the unfortunate events of the prior game were not going to develop into a lingering issue. Second, the overall team’s play was well-rounded and brilliant, including
really nice performances from Stephon Castle, Dylan Harper, and especially Keldon Johnson. Finally, it produced a box score jam-packed with highlights, as you’ll see below:
Note: Now that we’ve moved into the postseason, the reference period used for grading changes from the set of regular season games since 2012-2013 to the set of postseason games since 2012-2013. Unless otherwise noted below, this set DOES include play-in games. As of the end of May 12, 2026, this group include 1,186 games.

Factors that decided the game
- The Spurs held mild-to-solid edges in turnovers (-1), offensive rebounds (+1), and defensive rebounds (+7), though the latter advantage was largely driven by the fact that Minnesota created many more of opportunities for defensive rebounds through their poor shooting (more on that below).
- Both teams committed 24 fouls, but the Timberwolves did take three more free throws and shot a slightly better FT% (+2.22 percentage points). As such, they enjoyed a FTM margin of +3.
- What really decided this game was volume and efficiency from the field overall, where the Spurs’ advantages ranged from notable to massive. First, San Antonio had a volume advantage of +6 FGA. Much more importantly, their FG% differential was a whopping +14.25 percentage points. Ultimately, San Antonio outscored Minnesota by 32 from the field by making 15 more total shots (including two more threes).
Rare Box Score Stats
- As I’m sure you’ve guessed, Wemby’s stat line is yet another absurd gem in a growing collection of unicorn performances. Let’s start with the fact that Victor logged just the eighth stat line in a true playoff game since 1996-1997 that included 27+ points, 17+ rebounds, 5+ assists, and 3+ blocks. The other seven cases were achieved by just three players: Tim Duncan (3), Shaquille O’Neal (3), and Anthony Davis (1).
- Furthermore, Victor joined this elite club in just 32:38. Of the seven other performances mentioned above, the shortest was a 41:35 long outing by Shaq in the 2004 Western Conference Finals against none other than Minnesota.
- Since the 1996-1997 postseason, the only other players to log 27+ points, 17+ rebounds, and 5+ assists in a true playoff performance lasting no longer than 32:38 are Giannis Antetokounmpo and Nikola Jokic, and both fell short of Victor’s block total.
- This was just the 12th postseason contest since 2012-2013 in which a team lost by 29+ points while having at least 30 free throw attempts. Furthermore, last night’s contest marked just the third occasion in the same period in which a team lost by 29+ points while making 26+ free throws.
- This is the 50th postseason game since 2012-2013 in which the winning team earned a FGM differential of 15+. That’s not wildly rare (about once every 24 postseason games), but still a notable milestone.
What are Team Graded Box Scores?
Very briefly, these box scores grade winner-loser differentials for basic box score statistics, with the grade being based on the winning team’s differential relative to other NBA winners during a defined reference period. Think of it like a report card for understanding how a given winner performed relative to other winners. The reference period used runs from the start of the 2012-2013 season to the latest date of play, including only games in the same season category (i.e., regular season and playoff games are not compared to each other).
Data Source: The underlying data used to create these box scores was collected from Basketball Reference. In all cases, the data are collected the morning after the game is played. Although rare, postgame statistical revisions after data collection do occur and may affect the results after the fact.