

There has been considerable discussion on Hogs Haven about the desirability of using offensive tactics such as motion, play-action passing and the shotgun formation. However, the commentary is based mostly on the poster’s preferences and biases. There is surprisingly little hard evidence about how well those tactics work. This article is based on a unique dataset with measures of eight common offensive tactics and two types of outcomes: offensive effectiveness (three measures) and quarterback injuries
(two measures). I created the database using six different data sources. You are seeing it all here at Hogs Haven, folks, and not from behind a paywall.
If there is sufficient interest, I will write another article that takes a deeper dive into how teams package tactics into offensive schemes. That is a complex topic that requires a full separate article. (Teaser: the common wisdom about what NFL teams use which offensive schemes is wrong.) Since most readers want to know what difference the tactics make for scoring, wins and QB injuries, we focus on those relationships in this article.
I assume that the offensive tactics and outcomes considered in the paper are familiar and that readers can dive straight into the results of my analyses, which is what most readers will care about. Therefore, I have organized this article back-asswards from an academic article. I will put the sections that cover the rationale for each tactic, hypotheses (without using that term), measures, sources and methods at the end of the article in separate sections. Those who are interested in the analytical detail can read the appendices.
Summary of Measures
I used data from the full 2025 regular season. I did not include preseason or postseason games in the analysis. The formal definition for each measure, the rationale for using it and its data source are provided in the first appendix.
Anyone who has the time and interest could recreate my database and conduct their own analyses using that information.
The list of measures used in this article is shown in the following table.
Variables Analyzed
Use of Eight Offensive Tactics by NFL Teams
The next table provides the descriptive statistics (means, standard deviations, medians and range) for the eight offensive tactics. Note that the mean (average) and median (50th percentile) are quite similar for almost all these measures. That indicates that the distribution of the data for those metrics is relatively normal (and that makes your author happy because the analysis is more straightforward).
The biggest gap between mean and median is for no huddle rate and that distribution is very skewed. The Commanders were a huge outlier in 2025 and under then-offensive coordinator Kliff Kingsbury, using no huddle 60% of the time (more than 6 times the mean), and the Giants and Saints used no huddle more than 20% of the time (more than twice the mean).
The table suggests several conclusions about the use of these tactics.
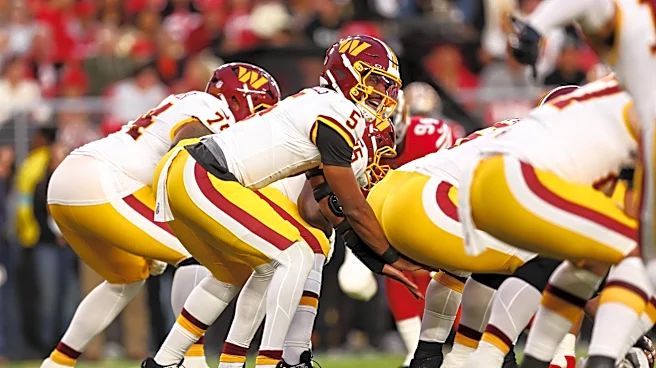
- All NFL teams use almost all these tactics to some degree. It is not a matter of using some and not others. For example, one of the more controversial tactics for Hogs Haven posters is use of the shotgun rather than starting the play from under center. The average NFL team used the shotgun almost two-thirds of the time; the team that used the shotgun the least (the Rams) still used it 40% of the time. (Washington made the heaviest use of it in 2025 at a whopping 87% of the time.) Similarly, all teams made relatively heavy use of motion (range of 39% to 68%). The Kingsbury-led Commanders used it 49% of the time.
Descriptive Statistics for Offensive Tactics
- However, some tactics are used much less commonly than expected. There has been extensive discussion of play-action passing on Hogs Haven, but it’s used rarely. The league average is 15.5%, and the heaviest user (the Rams) only used it 21% of the time. There are two possible explanations. The first is that play-action doesn’t work well unless it has been set up by the running game and is relatively rare and thus surprising. The second explanation might be that the heavy league-wide use of the shotgun limits play-action usage. However, Washington used the shotgun 87% of the time and still ran play action 17% of the time, above the league average, so that doesn’t appear to be true.
- Some tactics are used within a narrow range. Nearly all teams ran the ball between 40% and 49% of the time. Only four teams ran less than 40% of plays (the Cardinals were the lowest at 34%, followed by the Bengals, Titans, and Raiders) and only two teams ran at least 50% of the time (the Seahawks at 50.0% and the Bills at 50.6%). One question outstanding is whether the bad teams that ran less performed poorly because they didn’t run the ball enough or whether they passed more because they were consistently behind in games; and whether the two teams at the high end succeeded because they ran so much or whether they ran so much because they were consistently leading late in games and running out the clock.
Pass Rate over Expected addresses this last question to some degree. Considering the total situation (down, distance, field position, etc.), teams were still inclined to run slightly more than expected (average was -.02, meaning more runs than expected). PROE varied quite a bit. Teams with the highest PROE (more likely to pass than expected) were the Rams, Chiefs, Cardinals, and Patriots. Teams with the lowest PROE (more likely to run than expected) where the Jets, Ravens, Seahawks and Falcons. Obviously, there were playoff teams (including a Super Bowl team) and bad teams on both lists. Note that the list of teams high and low in rushing % and PROE did not overlap strongly.
Air Yards / Attempt (AYA) was in a fairly narrow range. Teams threw beyond the line of scrimmage but not too far beyond – enough for a first down if the team had some yards after catch or positive yardage on other plays. But on average, teams weren’t throwing deep enough for a big gain unless the receiver broke free. The average AYA was 7.8 yards. All teams threw between 6.0 AYA (Seahawks, followed by the Lions at 6.4) and 9.2 AYA (Patriots, followed by the Rams at 9.1 and Eagles at 9.0). It’s interesting that both the high and low lists were heavily populated by playoff teams (with a Super Bowl team both highest and lowest). Given the narrow range, NFL passing clearly is now oriented toward ball control. - One metric where there was a large difference across teams was QB run yards. The average was 303 yards rushing from quarterbacks, but the standard deviation was over half that total (185 yards). Washington (630 yards), the Giants (616), Bills (585), and Chargers (583) led the pack, while the Rams had minus-9 yards, the Lions had 42, and the Steelers had 67. Both scheme and having a skilled running quarterback (or multiple running QBs) predict the number of yards.
Outcomes
Offensive Effectiveness Outcomes: Scoring shows a nice, normal distribution. So does EPA (Expected Points Added) per play. Note that the mean for EPA is 0; the average play neither adds nor subtracts points from expected. Wins averaged 8.5 for the season, or exactly half the games played, realizing the NFL dream of perfect parity, again with a nice distribution.
Good distributions for most of the tactics and for all three outcomes make it possible to achieve high correlations between variables. Badly behaved distributions are a statistical problem but are not an issue with these data.
Quarterback injuries were differentially distributed. The average team reported almost 3 quarterback injuries during the season, but five teams reported no QB injuries while, at the other extreme, Tampa Bay reported seven in 2025.
The injuries listed (see the appendix for the source) are horrific. It is like reading the case list from a Level 1 Trauma Center on a busy Saturday night. At least one quarterback suffered the following broken bones: orbital bone (eye socket), nose (2 cases), ribs, thumb on his throwing hand, left wrist, fibula, foot (2 cases) and ankle. The list also includes assorted torn ligaments, sprains, lacerations, and much more. But NFL quarterback play through injuries. The injuries that they played through without missing a game are astounding. Baker Mayfield alone suffered 10 injuries in seven injury reports (MCL sprain, foot sprain, turf toe, right biceps strain, knee sprain (three times), oblique strain, left shoulder AC sprain and right shoulder AC sprain), yet he never missed a game.
Injury severity is interpreted as QB games missed, but this is a difficulty. Despite all the injuries, QBs are a tough breed, and the QBs for 14 teams missed no games at all. The average team lost their QB for three games – a reason that backup QBs are so valuable in the NFL. Some teams showed a lot of games missed; 12 or more were lost for the Vikings, Colts, Commanders, and Cardinals. However, QBs played through a lot of injuries in 2025, and those who missed time suffered injuries that could not be overcome (such as a torn Achilles’ tendon or Jayden Daniels’ dislocated left elbow that was reinjured).
However, whether a QB misses any games, or multiple games, because of injury is based on many factors. These include the pain tolerance of the QB, the strength of the week’s opponent and whether the team is trying to reach the playoffs or tank their record for better draft position. Even worse, timing strongly affects the results. A QB who tears his ACL in Game 1 misses 16 games due to the injury; a QB who does the same in Game 16 misses one game. Same injury, same severity, different result. However, QB Games Missed is the best measure that I can find for severity of QB injuries, so I have used it in my analyses, even though it is a “noisy” measure.
Offensive Tactics and Offensive Effectiveness
Now we come to the part of the article that will be of greatest interest for most readers. Here we ask about the positive and negative effects different offensive tactics had in 2025.
The following table shows the correlations between each of the offensive tactics and each of the three measures of offensive effectiveness: scoring, EPA and wins. EPA (Expected Points Added) is a currently fashionable metric that scores the expected point value of each play based on historic data on down, distance, field position and time remaining.
Appendix 2 offers a primer on correlations for readers unfamiliar with them. I report only results that are statistically significant – that is, unlikely to be due to chance. Some of these results are impressively significant, while many are nonsignificant.
Offensive Tactics and Effectiveness
Motion is unrelated to any effectiveness outcome. Many on Hogs Haven have claimed for years that motion is essential to offensive success. Instead, the results confirm what I have said for years: this century-old tactic has become irrelevant in the modern NFL. Like the rain dance and Russian elections, it is a common, repetitive pattern of behavior that has no effect on any important outcome. Good defenses disguise their formation until immediately before or just after the snap, too late for motion to help. A damning problem: at best motion tells you whether the defense is in man or zone, but we already know that most teams use zone, and not saying anything about what type of zone (Cover 2, Cover 3, Quarters, etc.) makes the information that motion provides just about useless today.
Play-Action Rate is significantly related to both Scoring and EPA, with correlations of .32 and .34. This is some of the best data that I have seen to indicate play-action’s value. I found this result quite surprisingly strong. Many on Hogs Haven have argued for more play action from Washington; they have support for that now. Note that the correlations account for 10 to 12% of the variance in Scoring and EPA. (See Appendix 2: the correlation times itself is the r-squared, and it is the percent of variance in the outcome that is explained by the predictor.) That high a result represents an advantage that any offensive coordinator should be interested in gaining.
Air Yards/Attempt is only related to EPA, not Scoring or Wins. However, the relationship with EPA is probably spurious. The formula for EPA overweights long passes, so there should be a positive correlation between these variables. The relationship is what academics call “tautological” – built into the definition of the variables. The relationship of AYA to scoring is not only nonsignificant, but also close to zero. This is bad news for 1970s-style Air Coryell fans.
The Shotgun Rate is the inverse of the Under Center Rate, and the hypothesis tested here is whether a higher Under Center Rate leads to more scoring and higher EPA. In this case, a negative relationship of offensive effectiveness to the Shotgun Rate was expected and favors playing under center. These correlations here are some of the strongest evidence that I have ever seen indicating that playing under center more (that is, using the shotgun less often) leads to a better offense. The correlations are very large and strikingly significant (at the 1 in 1000 level for two of the results). The rate of under center play accounted for almost 40% of the variance in scoring and well over 40% of the variance in wins. That is a stunning result. The correlation between Under Center Rate and EPA was also large and highly significant at .44, but not as impressive as the other two results.
There is still the possibility that the high correlation results from reverse causality. That is, teams that are losing tend to use the shotgun more because they must pass and the shotgun is used mostly as a passing formation. There is no easy way to disentangle this with the data. It is true that most of the teams that made the heaviest use of the shotgun in 2025 were bad teams, including the Commanders, Cardinals, Giants, Jets, Dolphins and Titans. The Eagles were heavy users and made the playoffs; the Chiefs, Commanders, and Bengals had down years but were heavy users in other years in which they performed very well offensively. On the other hand, all the heaviest users of Under Center Rate were good teams, most making the playoffs and two of them reaching the Super Bowl.
I ran across an excellent, heavily data-based article on use of the shotgun while writing this article, and I highly recommend it (see here). The author found that Under Center is a better passing formation and that the Shotgun is a better running formation – exactly the opposite of what most people believe. Overall, the results of this article complement his findings (which are based largely on 2024 data).
One final point is that the data do not support the idea that use of the shotgun is bad. All teams used the shotgun, differing only in their degree of usage. The advice based on the evidence here would be, use under center more than the average team but expect to use the shotgun a lot, as all NFL teams do.
The No Huddle Rate tests of significance tested the hypothesis that failing to huddle has a negative effect on offensive performance. There was in fact no relationship between No Huddle Rate and either Scoring or EPA. (Sorry, Kliff Kingsbury.) No Huddle was significantly and negatively related to wins, but we must be suspicious of reverse causality here. That is, losing teams tend to go no huddle in the fourth quarter of games in which they are losing because they can’t take the time to huddle. The fact that no huddle had a low correlation to scoring and EPA would seem to be consistent with that possibility.
QB Run Yards is a highly controversial topic on Hogs Haven. However, QB Run Yards had no significant relationship with any offensive outcome. Indeed, the correlations were nearly zero on all three measures. Based on these data, one would not see a team with a running QB as more or less dangerous than a team without one. That’s interesting in the era of the mobile QB. But does running the QB get him injured? More on that below.
Rushing Percentage. The conventional NFL wisdom that running the ball is a key to offensive success appears to be true. The correlations were moderate, ranging from .34 to .43 (12 to 18% of the variance in scoring, EPA and wins). The correlation was strongest for wins, which again raises the reverse causality explanation: perhaps winning teams were running out the clock more often.
The data for Pass Rate over Expected (PROE) appear to indicate that PROE is moderately related to scoring and EPA. This implies that more passing and less running than expected in each given situation is somewhat helpful to the offense. I have no compelling idea of how to reconcile this finding with the previous one. Both Rushing Percentage (more rushing) and PROE (more passing) are positively and significantly related to the same outcomes. My best thought is that play-action passes work if they are passes when the defense expects a run; perhaps those passes alone explains the PROE finding. If you have ideas on this, please share them in the discussion.
Summary
Several Offensive Tactics are significantly related to Offensive Effectiveness (Scoring, EPA, and Wins). The strongest effects are for Under Center Rate (the inverse of Shotgun Rate), Play-Action Rate and Percentage Rushing. Passing over Expected and more huddling were related to one or more outcomes. Motion Rate and QB Run Yards are unrelated to any offensive outcome: scoring, EPA, or wins. The only relationship between Average Yards per Attempt and any outcome is EPA, and that correlation is probably spurious, since it is embedded in the EPA calculation.
One further note: I have concluded that EPA is an emperor with no clothes. It is correlated .89 with scoring, an extremely high correlation that indicating that EPA is not adding much useful information above and beyond Scoring. EPA is faddishly popular because it is pseudo-scientific, complex and opaque, but the only case in which it led to a significantly different conclusion than points, which is simple and easy to look up, was for AYA, and as I have said, that correlation was probably spurious.
Offensive Tactics and QB Injuries
The table below summarizes the correlations between Offensive Tactics and QB Injuries, as indicated by appearances on the injury report and QB Injury Severity, measured by the number of weeks missed by QBs on a team’s roster. Although many posters advocate one or more tactics because the alternative is “not sustainable,” meaning it gets the QB injured, there is little support for those ideas in the data.
Only two tactics were significantly (and negatively) related to QB injuries: Play-Action Rate and running the ball more (the inverse of Passing over Expected) both moderately reduced QB injuries. However, correlations are only moderate, and account for only 9% and 12% of the variance in QB injuries. Play-Action Rate makes sense, since it can reduce the pass rush. I struggle to understand why passing more than expected protects the QB, unless the metric counts play-action passes as passes over expected.
Nothing else was significantly related to QB injuries. In particular, the number of QB rushing yards was unrelated to QB injuries, which some may find hard to believe (I do not). Whether a QB is injured depends mostly on the QB’s physique, elusiveness and willingness to avoid hits (e.g., by sliding). And, of course, luck.
It is notable that NONE of the offensive tactics were significantly related to QB Injury Severity. I have indicated that this is a “noisy” metric, and perhaps the lack of significant correlations has more to do with the weakness of the measure than the relationships. But we have no better measure of severity at this point and must consider any discussion about the relationship between Offensive Tactics and QB Injury Severity to be speculative.
Conclusion
My work on this article has me rethinking my opinion about several offensive tactics and confirmed my biases about others. I always thought motion was the most useless tactic in football, and I feel confirmed. I was very surprised to see the degree to which playing under center appears to be valuable for offensive success. Conventional wisdom about the importance of the run game is upheld – as long as you pass a little more than expected (please explain that to me!). Conventional wisdom about the value of play-action also finds support. I have thought that it was dangerous to let the QB run, but not nearly as dangerous as most believe. Actually, it appears that it doesn’t risk unusual injury to the QB but also doesn’t necessarily help or hurt the offense overall.
Summing it up for David Blough and those of you aspiring to take his place:
- Run the ball more than the other guy
- Use Under Center more, which doesn’t mean abandoning the Shotgun entirely
- Use Play Action more than the other guy
- Pass a little more than expected
- Quit using Motion and No Huddle, they don’t help you
- Don’t worry about passing it deep more often than the opportunity presents itself; ball-control passing is fine and more AYA won’t help you
- Let Jayden run wild. It may or may not bring wins, but it won’t necessarily get him hurt, and it’s fun
- To protect the QB, use Play-Action more and pass a bit more than expected. Then pray, because nothing else seems to make a bit of difference in avoiding injuries to your lead gladiator.
Appendix 1: Measures and Sources
OFFENSIVE TACTICS
- Motion rate is the percentage of offensive plays (runs and passes) in which an offensive player changes position before or during the snap.
- Why it may work: Motion is used to determine whether the defense is playing a man or zone pass defense on that play. It can also be used to position extra blockers for the run.
- Source: Measures 1 – 5 are compiled by Sharp Analytics. They have generously agreed to share an archived copy of the data for the full 2025 season, which you may inspect here. I encourage readers to access these data; they are organized by team, and you can sort data for each measure from high to low. Many thanks to OffSeasonOptimist, who alerted me to this resource in a recent discussion on a Feed post.
- Play action rate is the percentage of passing plays for which the quarterback uses fakes handing the ball off to a running back before pulling it back to pass.
- Why it may work: The play potentially deceives the defense, with some defenders trying to stop the fake run, providing time for the receiver(s) to get open downfield while slowing the pass rush.
- Source: Sharp Analytics (see above).
- Air Yards per Attempt (AYA) is the average distance that the football travels beyond the line of scrimmage through the air on passes. It is an indication of the aggressiveness of the offense and its willingness to throw downfield.
- Why it may work: A team can score from their own 25-yard line with just one or two long passes. A team would need to complete 11 passes shorter passes of 7 yards to score from the same spot, which is difficult to accomplish.
- Source: Sharp Analytics (see above).
- Shotgun rate is the percentage of offensive plays in which the quarterback lines up several yards behind the line of scrimmage rather than under center. It is the inverse of the under center rate.
- Why it may work: The quarterback is potentially safer because he can see the pass rush (and never turns his back to the defense); running backs can get a running start toward the hole by lining up deeper.
- Source: Sharp Analytics (see above).
- No huddle rate is the percentage of offensive plays in which the team snaps the ball without first gathering in a huddle.
- Why it may work: The defense is unable to substitute unless the offense does, leaving the defense potentially winded and unable to adjust personnel for the down and distance. Also, this uses less time off the clock near the end of the game for a team on offense that is behind and trying to conserve the clock.
- Source: Sharp Analytics (see above).
- Quarterback run yards is the total number of rushing yards for all quarterbacks on the roster during the season.
- Why it may work: Having a dual threat QB eliminates the advantage of the defense in having 11 players to cover 10; QBs who are effective runners can be a devastating weapon.
- Source: Pro-Football-Reference.com (see here for a link to the site). I added the rushing yards for all QBs on the roster for all 32 teams.
- Percentage of rushing plays is the percentage of offensive plays that involve a rush attempt rather than a pass attempt. It is the inverse of the percentage of passing plays plus sacks.
- Why it may work: An effective rushing attack lets the offense control the game and wears down the defense. It has been assumed for most of the history of the NFL that an effective rushing attack is the key to a great offense.
- Source: Google Analytics provided the data for each team.
- Pass Rate Over Expected (PROE) subtracts a team’s expected pass rate (calculated by rating every play based on down, distance, field position, time left, and scoring difference) from their actual dropback rate (including passes, sacks, and scrambles). A positive number indicates that the team passes more than normal for the situations it faces, while a negative number indicates that it passes less often than would be normal for the situations it faces.
- Why it may work: PROE addresses a problem with percentage of rushing plays. That measure may reflect situations more than scheme. For example, winning teams tend to run out the clock when they have a significant lead, so a high percentage of running plays may reflect success more than it causes success. PROE is not perfect, but it measures the degree to which a team passes (or runs, which is the inverse measure) more often than expected given its situation.
- Source: Data for PROE for each team in 2025 are from RBSDM.com (see here).
Offensive Effectiveness
I used three measures of offensive effectiveness. These were:
- Scoring is the total points scored by the team during the 2025 regular season. Some points may be scored by the defense or special teams (other than field goals, an obvious offensive statistic), and I could not easily separate those out. That adds a little “noise” to the data. However, over the course of a season, few teams score many points except through their offense, and the results indicate that ignoring other sources of scoring did not matter.
- Source: Pro-Football-Reference.com (see above).
- EPA (Expected Points Added) per play is a modern analytic metric that subtracts the difference between the expected point value after each play from the expected point value before the play. The calculation considers historic data on game situations, including down, distance, field position, and time remaining and compares that to the actual play.
- Source: SumerSports.com, found here.
- Wins is the number of wins during the regular 2025 season.
- Source: Pro-Football-Reference.com (see above).
I used two measures of quarterback injuries. Both are taken from a database compiled by Jesse Morse, MD and reported on a website called Injury Expertz. Data for 2025 are here. Dr. Morse provides an array of measures. The two best for our purposes are:
- Quarterback Injuries, which is the number of times any quarterback for a team appears on the team’s weekly injury report to the NFL. This is important because many argue that certain tactics are responsible for QB injuries (most notably, QB runs).
- Quarterback weeks out with injuries attempts to address injury severity. This measure is imperfect for several reasons. Most important, the same injury at different points in the season has different outcomes. For example, a torn Achilles’ tendon in Week 1 leads to 16 weeks out, whereas the same injury in week 16 leads to missing one game. However, it is the best severity measure that I can find.
Appendix 2: Correlation Analysis
Some points worth remembering about correlations:
- Correlations range from -1 (a perfect negative relationship) to +1.0 (a perfect positive relationship).
- Statistical significance at the .05 level or greater indicates that the results are unlikely to be due to chance. For example, statistical significance at the .05 levels means that the odds are 95 in 100 that the result is “real” and not due to chance; significant at the .01 level means that the odds are 99 in 100 that the relationship between variables is not the result of chance.
- Statistical significance is directly related to sample size. In large scale survey studies with thousands of cases, every correlation may be statically significant, no matter how tiny. For the data here, with 32 cases (the number of teams in the NFL), a correlation of .30 is needed to show statistical significance.
- For the stats nerds in the audience, I used one-tail tests of significance. I did this primarily because I did not have enough cases for two-tailed tests. That means I am testing the hypotheses that each of the tactics had a positive (or when appropriate, a negative) relationship to offensive effectiveness and QB injuries. For example, I hypothesized that shotgun rate would be negatively related to offensive effectiveness (or said another way, that the inverse, or under center rate, would be positively related to effectiveness). I tested whether all other tactics were positively related to effectiveness. For injuries, I tested whether QB running yards and Air Yards per Attempt and Pass Rate over expected would have a positive relationship to QB injuries (because these tactics exposed the QB more) and that all other tactics would have a negative relationship to QB injuries.
- Practical significance, as opposed to statistical significance, is indicated by the r-squared statistic. That is simply the correlation multiplied by itself, and it indicates the percent of the variance that is accounted for by the correlation. Here are some examples of correlations and their corresponding percentage of the variance accounted for by the r-squareds.
r and Corresponding r-Squared Values
- In my opinion, statistical and practical significance are very similar in these data. A correlation of .30 accounts for just 9% of the variance. I do not have enough faith in these data to believe that such a lower percentage is meaningful to an NFL team. Many factors affect scoring, or EPA, wins or QB injuries. Focusing on something that accounts for only just a few percentage points of the variance seems excessively nerdy and unrealistic. However, at a correlation of .30 – when these data reach statistical significance – you are explaining 9% of the variance. That begins to be meaningful and offer competitive advantage. There are some very strong correlations in these data that have obvious practical implications.
Some may wonder why I did not perform more sophisticated analyses, such as multiple regression. The reason is simple: sample size. With just 32 cases, it is acceptable to use only two predictors and one outcome in a regression. I experimented with two-predictor regression analyses, and I did not see any instances in which the findings were different from those for correlation analysis. Therefore, I stuck to correlations, which are easier for most readers to understand.
There’s plenty of revealing data from LASkin in here about Washington’s offense and NFL offensive tactics in general. Let’s discuss what we’ve learned in the article comments below: