

Conference realignment has paused for a bit with Stanford and Cal in the Atlantic Conference and Oregon and UCLA in the same conference as Maryland and Penn State. But at least Washington is in the northwest part of the country and therefore close to Northwestern, right? In the meantime, the MWC and PAC-12 have stabilized, at least for now.
This week on Stats Corner, we answer a question fans of both conferences have been asking: was the grass actually greener on the other side? Are things better
for the teams who moved conferences, or for those who stayed?
The Method
To answer the question, we’re looking at rankings, specifically ESPN’s FPI rankings for consistently, from 2022 through 2026. For each team, we compare three numbers:
The 2026 ranking vs. the team’s 2022-2025 average: has the program improved relative to its own recent baseline?
The 2026 ranking vs. the 2025 ranking: the last year before realignment fully hit, are they trending up or down year-over-year?
There is a chart for each conference showing the rankings at the end of the article (sorry, graph colors do not match college colors).
There is, of course, a finance question underneath all of this. Utah State is reported to make between $3 million and $6 million more per year in the PAC-12 than it did in the MWC and that money gap is the driving force behind realignment, conference moves, and the NIL arms race. But money doesn’t win games directly; it funds facilities, staffs, and rosters. The FPI numbers below are our best window into whether the on-field results are following the money.
Note: North Dakota State is not included, as they were FCS and lack the multi-year FPI history for a fair comparison.
Teams Who Improved Their Ranking
MWC
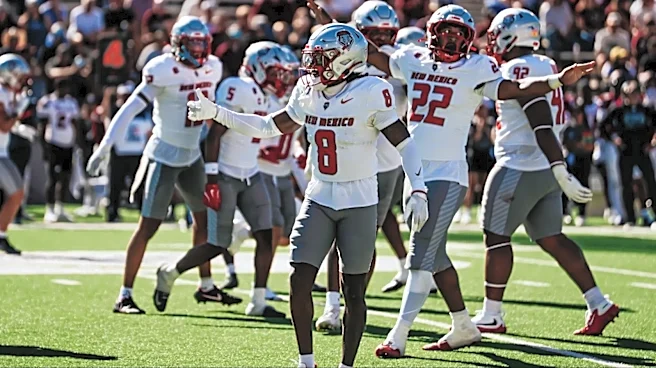
New Mexico — 2022: 128, 2023: 120, 2024: 107, 2025: 78, 2026: 39
Average: 108 | 2026 vs. average: +69 | 2026 vs. 2025: +39
Nevada — 2022: 123, 2023: 128, 2024: 103, 2025: 123, 2026: 104
Average: 119 | 2026 vs. average: +15 | 2026 vs. 2025: +19
San Jose State — 2022: 89, 2023: 68, 2024: 91, 2025: 119, 2026: 113
Average: 92 | 2026 vs. average: -21 | 2026 vs. 2025: +6
Air Force — 2022: 56, 2023: 63, 2024: 106, 2025: 96, 2026: 91
Average: 80 | 2026 vs. average: -11 | 2026 vs. 2025: +5
PAC-12
Oregon State — 2022: 19, 2023: 21, 2024: 96, 2025: 111, 2026: 60
Average: 62 | 2026 vs. average: +2 | 2026 vs. 2025: +51
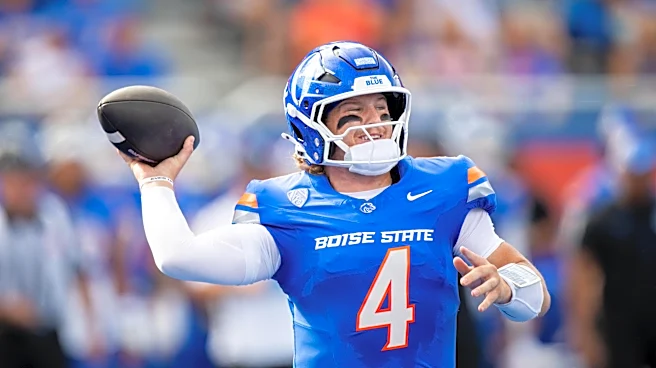
Boise State — 2022: 54, 2023: 47, 2024: 27, 2025: 55, 2026: 28
Average: 46 | 2026 vs. average: +18 | 2026 vs. 2025: +27
Fresno State — 2022: 57, 2023: 79, 2024: 81, 2025: 85, 2026: 63
Average: 76 | 2026 vs. average: +13 | 2026 vs. 2025: +22
Colorado State — 2022: 125, 2023: 112, 2024: 105, 2025: 115, 2026: 107
Average: 114 | 2026 vs. average: +8 | 2026 vs. 2025: +8
The two biggest winners of the MWC/PAC-12 realignment era are clearly New Mexico and Oregon State. The Lobos have gone from one of the worst teams in the country, ranked 128th in 2022, to a legitimate playoff contender in three short years, a +69-point climb against their own baseline. The Beavers tell the opposite kind of story: a top-20 program that bottomed out almost immediately once the PAC-12 broke up, and are now climbing rapidly back toward the top half of the country. Their +51 year-over-year jump is the largest single-season improvement on either list.
Boise State remains the model of consistency never far from the top 30, and back at 28th this year after a rare down 2025. Fresno State is having a similar bounce-back year after sliding for three straight seasons. San Jose State and Air Force both sit below their four-year averages but are improving from last year, a sign of stabilization rather than decline. And Nevada and Colorado State are the classic “nowhere to go but up” stories. To be fair to both, each is currently ranked the second-highest it has been in five years, and both are trending upward. Bad teams getting better is still realignment working.
Teams Holding Steady
MWC
UNLV — 2022: 106, 2023: 73, 2024: 40, 2025: 69, 2026: 74
Average: 72 | 2026 vs. average: -2 | 2026 vs. 2025: -5
PAC-12
Texas State — 2022: 125, 2023: 92, 2024: 62, 2025: 72, 2026: 76
Average: 85 | 2026 vs. average: +9 | 2026 vs. 2025: -4
Utah State — 2022: 109, 2023: 105, 2024: 110, 2025: 80, 2026: 96
Average: 101 | 2026 vs. average: +5 | 2026 vs. 2025: +16
UNLV bottomed out in 2022 and rebuilt themselves into a solid football program, they just seem to hover around the national average, peaking at 40th in 2024, but never quite taking the next step. The Bobcats have followed an almost identical arc: built from the bottom of the Sun Belt into a solid team, and like the Rebels, stuck in the 60s and 70s. These two programs are proof that the rebuild is possible; what neither has shown yet is the next gear.
The Aggies are the more interesting case. The Jordan Love years seem like a long time ago, as Utah State spent years stuck in the triple-digit rankings before hiring Bronco Mendenhall and getting a bump. This year is lower than 2025, but they remain above their four-year average and are +16 year-over-year. For a program whose entire realignment case was built on money and stability, “steady but unspectacular” may be exactly the outcome they signed up for.
Teams Who Wish Things Were Back the Way They Were
MWC
Northern Illinois — 2022: 119, 2023: 94, 2024: 86, 2025: 122, 2026: 128
Average: 105 | 2026 vs. average: -23 | 2026 vs. 2025: -6
UTEP — 2022: 108, 2023: 122, 2024: 130, 2025: 125, 2026: 136
Average: 121 | 2026 vs. average: -15 | 2026 vs. 2025: -11
Wyoming — 2022: 102, 2023: 74, 2024: 113, 2025: 110, 2026: 129
Average: 100 | 2026 vs. average: -29 | 2026 vs. 2025: -19
Hawaii — 2022: 129, 2023: 123, 2024: 115, 2025: 87, 2026: 114
Average: 114 | 2026 vs. average: -1 | 2026 vs. 2025: -27
PAC-12
San Diego State — 2022: 88, 2023: 110, 2024: 122, 2025: 67, 2026: 92
Average: 97 | 2026 vs. average: +5 | 2026 vs. 2025: -25
Washington State — 2022: 55, 2023: 51, 2024: 65, 2025: 64, 2026: 102
Average: 59 | 2026 vs. average: -43 | 2026 vs. 2025: -38
Most of these teams followed the same script: one good year before crashing back to earth. The Cowboys had 2023, the Huskies had 2024, he Rainbow Warriors and Aztecs had 2025. Each got a brief taste of relevance, and each has since fallen back below.
UTEP is the exception in the wrong direction: they’ve struggled near the bottom of the rankings throughout, and at 136 out of 138 teams, there’s simply nowhere left to fall. Washington State is the saddest story on the board. The Cougars survived the PAC-12 breakup better than Oregon State did, hovering in the 50s and 60s for years but 2026 has been brutal, with a -43-point drop against their baseline and a -38-point year-over-year slide. If Oregon State is the comeback story of this realignment cycle, Washington State is its cautionary twin.
So, Was the Grass Greener?
The honest answer from five years of FPI data: realignment didn’t change much for most teams — the money changed, not the football.
Of the fourteen teams tracked, five meaningfully improved against their own baseline, three held steady, and six got worse. That’s close to a coin flip, a pretty weak return on one of the most disruptive periods in college football history. The big winners (New Mexico, Oregon State, Boise State) got there through coaching hires, roster building, and timing, not because a conference logo on the schedule made anyone better. And the biggest loser (Washington State) fell further than any team rose. Meanwhile, the reported $3-6 million per year that motivated Utah State’s move is real (and the money will be similar for the other teams who joined the PAC 12), and it compounds every year through facilities, NIL, and staff salaries. The football scoreboard this year says “no big difference.” But realignment’s true test was never 2026 it’s whether the revenue gap eventually becomes a talent gap. Check back in five years.