

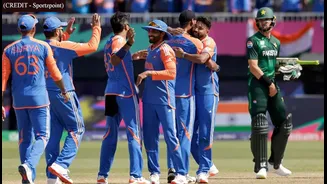
When India and Pakistan meet in a T20 World Cup, form tables become background noise. History steps forward.
On February 15 in Colombo, the rivalry adds
another chapter, one built not just on emotion, but on a clear statistical pattern. India have dominated World Cup meetings in the shortest format, often controlling tight chases and delivering under pressure when margins shrink to a handful of balls.
Here's how the rivalry stacks up.
India vs Pakistan in T20 World Cup: Overall Record
| Metric | India | Pakistan |
|---|---|---|
| Matches Played | 8 | 8 |
| Wins | 6 | 1 |
| Losses | 1 | 6 |
| Tied | 1 | 1 |
| No Result | 0 | 0 |
| Highest Team Score | 160 | 159 |
| Lowest Team Score | 119 | 113 |
The only tie came in the inaugural 2007 edition in Durbai: a match decided by a bowl-out. Pakistan's lone outright win came in 2021 in Dubai.
Outside of that, India have held control in high-pressure moments.
Overall T20I Head-to-Head
Across all T20 internationals - not just World Cups - India also maintain the upper hand.
Recent meetings underline a pattern: India's strength lies in structured chases and better execution in the final overs.
Here are some key recent results:
| Winner | Margin | Venue | Year |
|---|---|---|---|
| India | 6 runs | New York | 2024 |
| India | 4 wickets | Melbourne | 2022 |
| Pakistan | 10 wickets | Dubai | 2021 |
| India | 6 wickets | Eden Gardens | 2016 |
| India | 7 wickets | Mirpur | 2014 |
| India | 5 runs | Johannesburg | 2007 |
The Melbourne 2022 clash - driven by a masterclass chase - remains one of the rivalry's defining modern contests.
Team Records in India vs Pakistan T20 World Cup Matches
Highest & Lowest Totals
| Record Type | Team | Score | Venue | Year |
|---|---|---|---|---|
| Highest Team Total | India | 192/5 | Ahmedabad | 2012 |
| Highest Team Total | Pakistan | 182/5 | Dubai | 2022 |
| Lowest Team Total | India | 119 all out | New York | 2024 |
| Lowest Team Total | Pakistan | 83 all out | Mirpur | 2016 |
India's 192 in 2012 remains the highest aggregate in a T20 World Cup meeting between the sides. Pakistan's 83 in Mirpur reflects how quickly momentum can collapse in this fixture.
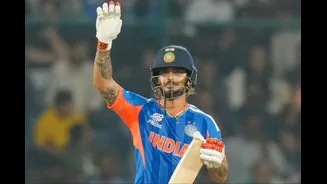
Most Runs in India vs Pakistan T20Is
Some players have consistently risen above the occasion.
| Batter | Inns | Runs | Avg | Strike Rate | Highest Score |
|---|---|---|---|---|---|
| Virat Kohli (IND) | 11 | 492 | 70.28 | 123.92 | 82* |
| Mohammad Rizwan (PAK) | 5 | 228 | 57.00 | 111.76 | 79* |
| Shoaib Malik (PAK) | 9 | 164 | 27.33 | 103.79 | 57 |
Kohli's numbers stand apart - nearly 500 runs at an average over 70 in this rivalry is elite consistency under extreme pressure.
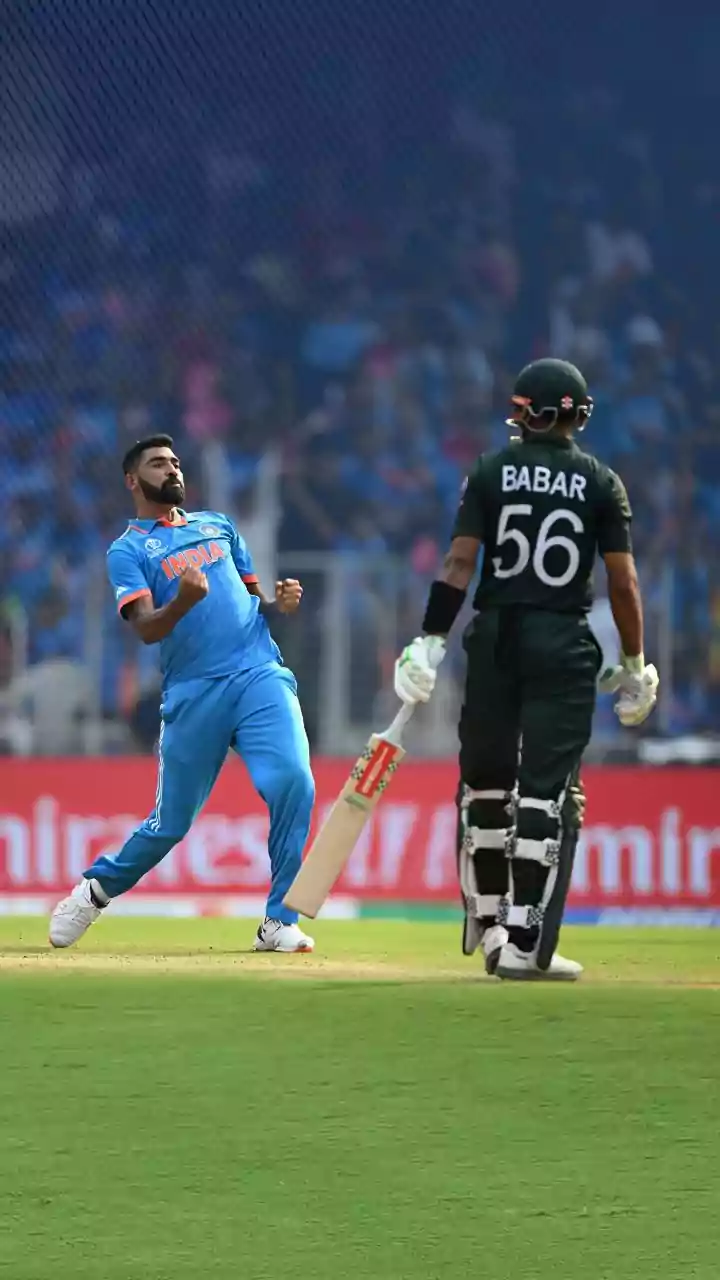
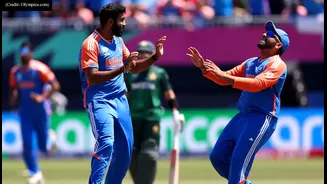
Most Wickets in India vs Pakistan T20Is
Bowling has often shaped these matches just as decisively.
| Bowler | Inns | Wickets | Economy | Average | Best Figures |
|---|---|---|---|---|---|
| Hardik Pandya (IND) | 9 | 15 | 7.96 | 14.60 | 3/8 |
| Bhuvneshwar Kumar (IND) | 7 | 11 | 7.26 | 17.18 | 4/26 |
| Umar Gul (PAK) | 6 | 11 | 8.27 | 16.18 | 4/37 |
Hardik's ability to break partnerships and Bhuvneshwar's control in the Powerplay have repeatedly tilted games India's way.
What The Numbers Actually Tell Us
India's advantage is not built on one era - it stretches from 2007 to the present. The pattern is clear:
India close games better. Pakistan tend to surge, but struggle to sustain pressure.
Individual brilliance has mattered - but composure in final overs has mattered more.
T20 cricket is volatile by design. A couple of overs can flip everything. But history shows that when India and Pakistan meet on this stage, India have more often handled the chaos better.
On February 15, the numbers reset. But the pressure? That never does.