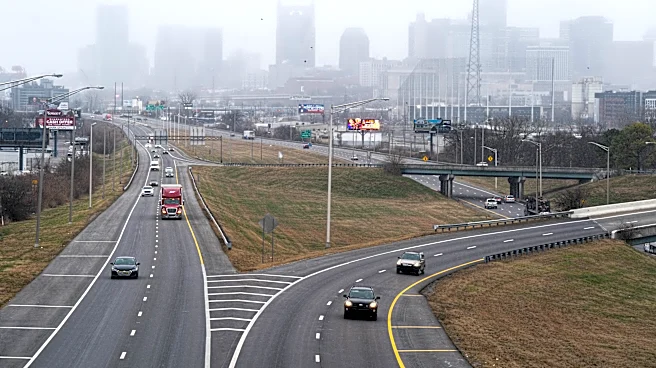









Using 2024 crash data, Hard Rock Bet examined 5,874 recorded crashes on Tennessee roadways between 2020 and 2024 to determine where the Volunteer State ranks nationally for driving safety. The analysis also identified Nashville's most dangerous roads.
Any guesses?
What is Nashville's most dangerous road?

According to Hard Rock Bet's findings, shared with The Tennessean, the five Nashville roads with the most accidents between 2020 and 2024 are:
- I-24 (40)
- I-40 (29)
- I-65 (27)
- US-31W/41 SR-11 DICKERSON PK (19)
- US-31A/41A SR-11 NOLENSVILLE P (17)
What are Tennessee's most dangerous roads?
The roads in Tennessee that had the most crashes between 2020 and 2024 were:
- I-40 (314)
- I-24 (165)
- I-75 (71)
- I-65 (71)
- I-240 (53)
Which Tennessee cities had the most wrecks between 2020 and 2024?

The Tennessee cities with the most recorded car accidents between 2020 and 2024 were:
- Memphis (1017)
- Nashville (508)
- Knoxville (221)
- Chattanooga (141)
- Clarksville (112)
When do car crashes happen the most in Nashville?
In Nashville, the day and month when with the highest number of crashes between were Saturday and September.
Over the five-year period, 101 crashes were recorded on Saturdays out of a total
508 crashes. Thursday recorded the second-highest total with 76 crashes.
September saw the most crashes with 55, followed by December with 52.
What was Tennessee's worst year for car accidents?

During the five-year period analyzed in the study, 2021 recorded the highest number of crashes in Tennessee, with 1,229 accidents reported statewide.
Close behind was 2023 with 1,219, followed by 2022 with 1,214.
The fewest crashes were recorded in 2024 and 2020, with 1,093 and 1,119.
Does Tennessee have some of the worst or best drivers?
According to Hard Rock Bet's analysis of speeding tickets, crashes, DUI rates, speeding-related incidents and licensing standard Tennessee ranked No. 24 among all 50 states, scoring a 63.25 out of 100.
Hard Rock Bet identified these states as having the best drivers, along with their overall scores out of 100.
- Florida (83.85)
- Connecticut (82.82)
- Pennsylvania (77.38)
- Illinois (75.37)
- West Virginia (74.41)
The states with the worst drivers in the U.S. were:
- North Dakota (17.02)
- Utah (31.83)
- Wisconsin (44.45)
- Ohio (44.63)
- Iowa (44.89)
Methodology
Hard Rock Bet's ranking was based on five factors: speeding ticket rates, accidents per 1,000 drivers, DUIs per 1,000 drivers, speeding related incidents per 1,000 drivers and each state's driving license difficulty score. Researchers normalized the data and combined the metrics into an overall driving performance index from best to worst.
Hard Rock Bet analyzed statistics from the National Highway Traffic Safety Administration, part of the U.S. Department of Transportation.
Peter Burditt covers trending news and service journalism for The Tennessean. Contact him at PBurditt@nashvill.gannett.com.
This article originally appeared on Nashville Tennessean: Which Nashville road is the most dangerous? New study reveals the answer