




When the calendar flips to October, it’s easy to think the story of Halloween’s success is written in candy sales and haunted house tickets. But those numbers are just the opening scene. The real story lies in the data that shows why people engage.
Beyond the Box Office
Relying
solely on gross sales is like judging a hit movie by its opening night box office alone. It’s a significant number, but it’s a lagging indicator that misses the bigger picture. It tells you what already happened, not what’s about to. True demand is a measure of attention, intention, and excitement that builds long before a single dollar is spent. For the modern Halloween economy—spanning everything from pop-up costume shops to intricate theme park experiences—understanding the full spectrum of consumer behavior is crucial. Businesses that look beyond the transaction can better predict trends, manage inventory, and build loyalty that lasts long after the spooky season ends.
The Social Media Cauldron
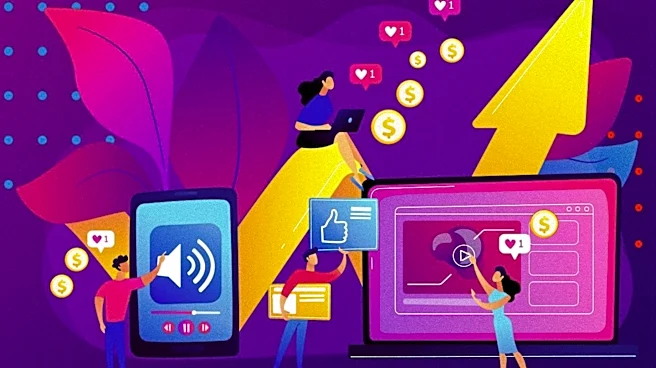
The digital town square is where modern demand is born and bred. Social media platforms provide a real-time focus group of millions. Metrics like share of voice (how much your brand is being discussed compared to competitors), post volume, and user-generated content are early predictors of interest. Are people using your event’s custom hashtag? Are they posting 'before and after' shots of their Halloween decorations from your store? Critically, sentiment analysis tools can reveal how people feel. Are conversations excited and positive, or are they frustrated by long lines and sold-out products? This data is invaluable for making operational adjustments on the fly and understanding what truly resonates with your audience.
The Trail of Digital Breadcrumbs
Long before someone buys a ticket to a horror festival, they search for it. Analyzing web search trends through tools like Google Trends can reveal rising interest in specific themes, costumes, or events weeks or even months in advance. A spike in searches for 'immersive horror experiences' in August, for example, is a powerful signal for event organizers. This data helps businesses forecast demand, allocate advertising budgets more effectively, and understand the specific language consumers are using. It’s the difference between guessing what people want and knowing what they are actively looking for.
Foot Traffic and Ancillary Spending
For brick-and-mortar locations, from pumpkin patches to seasonal pop-up stores, success is about more than just who walks in the door. It’s about how they behave once they’re inside. Modern analytics can measure 'dwell time'—how long shoppers linger in a specific aisle or area—and overall foot traffic patterns. High dwell time in a certain section suggests strong product interest, even if immediate sales don't reflect it. Furthermore, ancillary revenue—money spent on things other than the main ticket, like merchandise, food, and express passes—is a powerful indicator of true engagement. A guest who buys a ticket is a customer; a guest who also buys a branded hoodie, a themed cocktail, and a photo package is a fan. This secondary spending often reveals a deeper level of commitment and satisfaction.
Gauging Loyalty After the Ghost Disappears
The final, and perhaps most important, measure of demand isn't what people spent during Halloween, but whether they come back. Post-event surveys are a classic tool for gauging satisfaction. Asking attendees for feedback provides direct insight into what worked and what didn't. Beyond that, tracking repeat visits and customer retention is key. Did the first-time visitor to your haunted hayride sign up for your mailing list? Did the family who bought pumpkins this year return for your winter holiday event? A high repeat-customer rate is the ultimate confirmation that the experience you delivered created genuine, lasting demand.