









Your Old Friend, WAR
First, let's start on common ground: Wins Above Replacement, or WAR. In baseball, you know it's the ultimate single-number stat. It attempts to capture a player's total contribution—hitting, baserunning, and fielding—and boil it down to one number: how
many more wins is this player worth than a readily available, minor-league-level replacement? It’s context-dependent, adjusting for park factors and position, which is why a shortstop's solid all-around game can be more valuable than a first baseman's superior hitting stats. The core idea of WAR is to separate a player's true talent and value from the noise of team performance or luck. A great player on a bad team is still a great player, and WAR proves it. It’s a measure of value, plain and simple.
So, What Exactly Is xG?
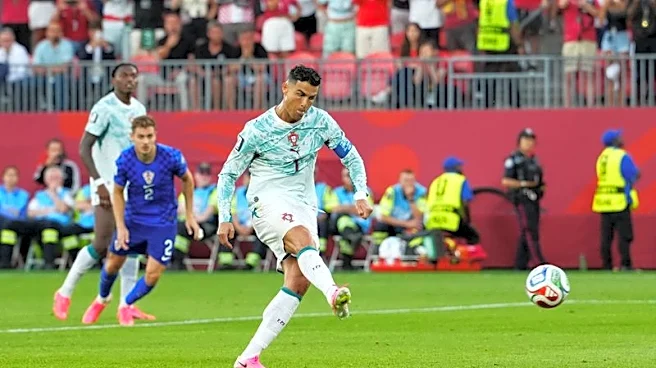
Now, let’s pivot to the pitch. Expected Goals (xG) isn't a direct analog to WAR's total player value, but it's born from the exact same philosophical parent: separating underlying performance from raw results. Where WAR measures a player’s total value in wins, xG measures the quality of a single shot. Using historical data from hundreds of thousands of shots, an xG model assigns a probability to any given attempt, from 0.0 (no chance) to 1.0 (a certain goal). A penalty kick, for instance, historically goes in about 76% of the time, so it's assigned a value of 0.76 xG. A desperate shot from 40 yards out might only have a 0.02 xG, meaning it would be expected to go in just once every 50 tries. The model considers factors like shot distance, angle to the goal, the body part used (foot or head), and the type of pass that set it up (a cross vs. a through-ball).
From Player Value to Shot Probability
This is where the WAR-to-xG translation clicks. WAR tells you a player’s value over a season. xG tells you the value of a team's scoring chances in a single game. Think of it this way: baseball has tons of discrete events, allowing WAR to aggregate all of a player's actions into a tidy number. Soccer is more fluid, but the most important discrete event is the shot. So, if a team takes 15 shots in a match, you don’t just count the shots; you add up the xG of every single one. Maybe they generated a total of 3.2 xG. If they won the game 1-0, they underperformed their chances—they were wasteful but created a lot. If they lost 4-0, the other team was ruthlessly efficient, lucky, or both. Just like WAR helps you see past a player's win-loss record, xG helps you see past a team's final score.
The 'Why It Matters' Angle
The same way you use WAR to settle a debate about who the real MVP is, analysts and fans use xG to understand who really controlled a game. Did your team lose 1-0 but post an xG of 2.8 to the opponent's 0.5? Then you can confidently complain that you were robbed, got unlucky, or faced a goalkeeper having the game of his life. It provides a narrative beyond the scoreboard. It helps identify strikers who are getting into great positions but are in a finishing slump (high xG, low goals) or teams that are winning but relying on unsustainable, low-probability goals (low xG, high goals). In the long run, performance tends to revert to the xG mean, making it one of the best available predictors of a team's future success. It’s the difference between saying "we should have won" and proving it with data.