







Beyond Yesterday's Metrics
For decades, the simple household rating was the undisputed king of television measurement. But in 2026, that single number tells an incomplete story. Viewers have endless choices, from linear cable and on-demand to ad-supported streaming services. Success
is no longer just about who tuned in for a premiere. It's about who you attract, how long you can hold their attention, and whether they come back for more. This is why a modern dashboard must prioritize a trio of more insightful metrics. Reach tells you the breadth of your audience, retention speaks to the quality and stickiness of your content, and repeat viewing measures the loyalty of your viewers to your channel or brand. Together, they provide a holistic view of audience health that a single rating cannot.
Step 1: Define Your Core Metrics
Before you can build anything, you need to be precise about what you're measuring. While tools and data sources may vary, the definitions are universal. Reach: This is the total number of unique people or households that were exposed to your content at least once over a specific period. It’s not about total impressions; it’s about how many distinct individuals you connected with. High reach means your marketing and scheduling are successfully drawing in a wide audience. Retention: This measures how well you keep viewers engaged within a single piece of content. For an hour-long drama, what percentage of viewers who started the episode finished it? Low retention is a red flag, suggesting the content itself isn't compelling enough to hold attention, even if the initial tune-in was strong. Repeat Viewing: This is the loyalty metric. It tracks how many viewers come back for subsequent episodes of a series or return to your channel for other programs. Strong repeat viewing is the foundation of a healthy cable channel, indicating that you have built a habit with your audience that transcends a single show.
Step 2: Structure Your Dashboard for Clarity
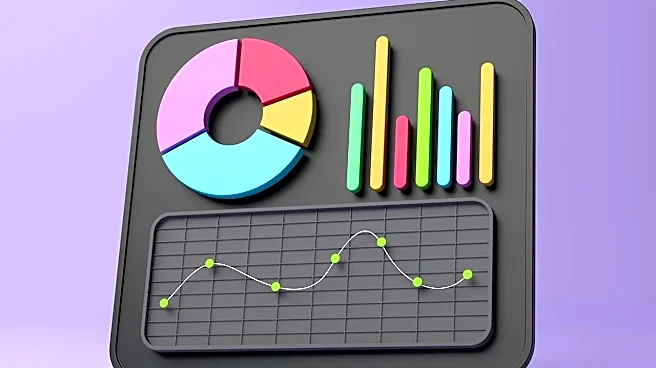
A great dashboard tells a story at a glance. Avoid the temptation to cram every available data point onto one screen. Instead, think hierarchically. Your main view should be a high-level summary of your three key metrics over a set period, like the last 7 or 30 days. Use clear color-coding—green for hitting targets, yellow for caution, red for problems—to make performance instantly readable. From this main view, each metric should be clickable, leading to a more detailed breakdown. For example, clicking on 'Reach' could show you a demographic breakdown of your new viewers. Clicking 'Retention' could show you minute-by-minute viewership graphs for specific shows, revealing exactly where audiences dropped off. 'Repeat Viewing' could display which shows are most effective at bringing audiences back week after week.
Step 3: Turn Insights Into Actionable Decisions
A dashboard is only as valuable as the decisions it helps you make. The goal isn't just to report numbers; it's to answer critical strategic questions. By analyzing the interplay between reach, retention, and repeat viewing, you can diagnose problems and identify opportunities. Scenario 1: High Reach, Low Retention. Your marketing for a new show premiere was a huge success, but viewers tuned out after the first 20 minutes. This suggests the promotional campaign was effective but the show itself failed to hook the audience. The problem isn't awareness; it's the creative content. Scenario 2: Low Reach, High Repeat Viewing. You have a show with a small but incredibly dedicated fanbase that returns every week. This program is a valuable asset for maintaining your core audience. The challenge here is a marketing one: how can you expand its reach to new viewers who are likely to become similarly loyal? By framing your data this way, your dashboard becomes a powerful tool for making smarter programming, scheduling, and marketing choices.