


The Problem of Too Much Data
Imagine trying to understand what makes a movie successful. You could track its budget, runtime, genre, lead actors, marketing spend, and critic scores. Now imagine tracking a thousand other variables, from the color palette to the number of lines spoken
by the third lead. You’d have a spreadsheet with thousands of columns for every single movie. This is ‘high-dimensional data,’ and it’s the native language of modern AI. For years, this data was a black box. A machine learning model could process it, but humans struggled to grasp the patterns hidden inside. How can you possibly chart relationships when you have more variables than dimensions in our known universe? You can’t just draw a graph; you’d need a thousand axes. This was the fundamental barrier to building intuition in the burgeoning field of AI.
Enter t-SNE: A Data Cartographer
In 2008, researchers Laurens van der Maaten and the so-called “Godfather of AI,” Geoffrey Hinton, published a paper introducing a technique to solve this problem. It was called t-Distributed Stochastic Neighbor Embedding, or t-SNE for short. Its purpose was simple in theory, but revolutionary in practice: to act as a cartographer for abstract data. t-SNE takes a high-dimensional dataset and projects it down into a two or three-dimensional space that we can actually see. The magic is in *how* it does this. It works tirelessly to arrange the data points so that similar items (like photos of cats, or tweets about a specific event) end up close together, while dissimilar items (cats vs. cars) are pushed far apart. It wasn't just about reducing information; it was about preserving local structure, or ‘neighborliness,’ to reveal the hidden architecture of the data.
From Numbers to Nebulae
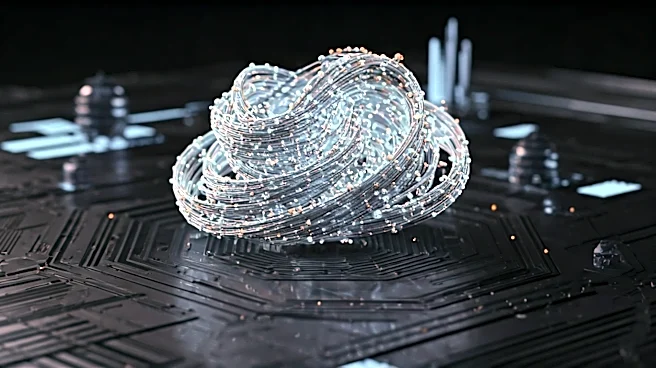
The results were stunning. Suddenly, impenetrable datasets became beautiful, intricate maps that looked like star charts or biological cells. These colorful, galaxy-like clusters became an iconic image of machine learning in the 2010s. For the first time, researchers could *see* their data. They could visually check if their model was correctly grouping different types of handwritten digits, or if a recommendation engine was properly clustering users with similar tastes. These visualizations weren't just pretty pictures; they were powerful tools for debugging and discovery. If you ran an image-recognition model and saw a cluster of dog pictures creeping into the cat cluster, you knew you had a problem to fix. This visual feedback loop dramatically accelerated research and development, making a deeply abstract process feel tangible and intuitive.
The Legacy and The Successor
Like any pioneering technology, t-SNE had its drawbacks. It could be computationally slow, especially with the massive datasets that became common later. More importantly, the plots could sometimes be misleading if you didn't know how to interpret them. The size of a cluster or the distance between two clusters in a t-SNE plot doesn't always mean what you think it means, a subtlety that often tripped up newcomers. In recent years, a new algorithm called UMAP (Uniform Manifold Approximation and Projection) has largely succeeded t-SNE as the go-to tool for visualization. It’s faster and often does a better job of preserving the data’s global structure. However, this doesn’t diminish t-SNE’s impact. UMAP stands on the shoulders of the conceptual giant that t-SNE built. The idea that we should—and could—visualize complex data to understand it was firmly established by t-SNE.