



What on Earth Is t-SNE?
Imagine you have a library with millions of books, but they’re all just thrown in a giant pile. You have no idea what’s in there. t-SNE, which stands for t-Distributed Stochastic Neighbor Embedding, is like a magical librarian. It doesn’t read the books for you,
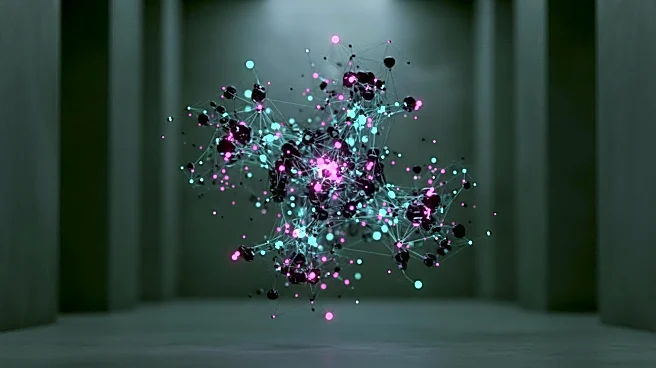
but it rapidly organizes them onto shelves, putting similar books next to each other. Suddenly, you have a visual map: a science fiction section, a history corner, a cluster of cookbooks. You can now see the structure that was hidden in the chaos. That’s what t-SNE does for high-dimensional data—data with so many features that it's impossible for a human to grasp. It takes that complex data and creates a simple 2D or 3D map where similar items are grouped together and dissimilar items are pushed apart.
The So-Called 'Prediction' Problem
Here's the most important thing to know: t-SNE does not predict the future. It's a visualization algorithm, not a forecasting one. It works on the data you already have. Running t-SNE is like taking a snapshot of the relationships within your data right now. The beautiful, colorful cluster maps it produces can be misleading. The size of the clusters, and the distance between them, don't have a reliable meaning. You can't say "this cluster is twice as important because it's bigger." Misinterpreting a t-SNE plot is one of the most common mistakes in data science. Think of it as a tool for generating hypotheses—a great way to start asking questions, not a machine for spitting out definitive answers.
Revealing the Patterns That Shape Tomorrow
If t-SNE doesn't predict, why is it so important for the next decade? Because its real power is in revealing patterns that were previously invisible. This is the key to making smarter future-facing decisions. For example, a biologist can use t-SNE to analyze thousands of cells, revealing a new, rare type of cancer cell that was hiding in plain sight. A cybersecurity expert can map network traffic, spotting a cluster of unusual activity that signals a new kind of attack. A media company can visualize user behavior, discovering a new audience segment with unique tastes. In each case, t-SNE didn't predict the cancer or the cyberattack. It illuminated the present complexity so clearly that a human expert could identify a critical pattern and act on it. This ability to make sense of complexity is its superpower.
Mapping the Complexity of the 2030s
The next decade will be defined by an explosion of data complexity. From personalized medicine based on our individual genomes to AI that generates its own content, we are creating datasets more vast and intricate than ever before. Tools like t-SNE (and its faster cousin, UMAP) are becoming essential navigation aids. They help data scientists and researchers get a feel for the terrain before building more complex models. As AI becomes more integrated into daily business, the ability to quickly visualize and understand the output of these complex systems will be crucial. The future of data analysis won't just be about automated reports; it will be about interactive, intelligent systems that allow humans to explore and question the data, and t-SNE is a foundational tool for that exploration.