
More Than Meets the Eye
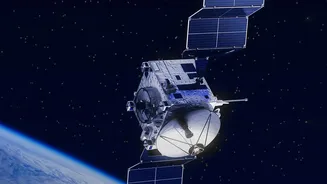
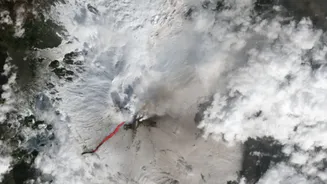
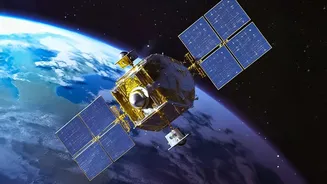
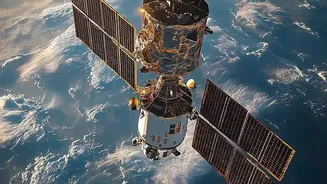
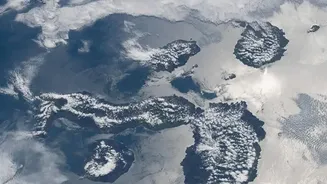
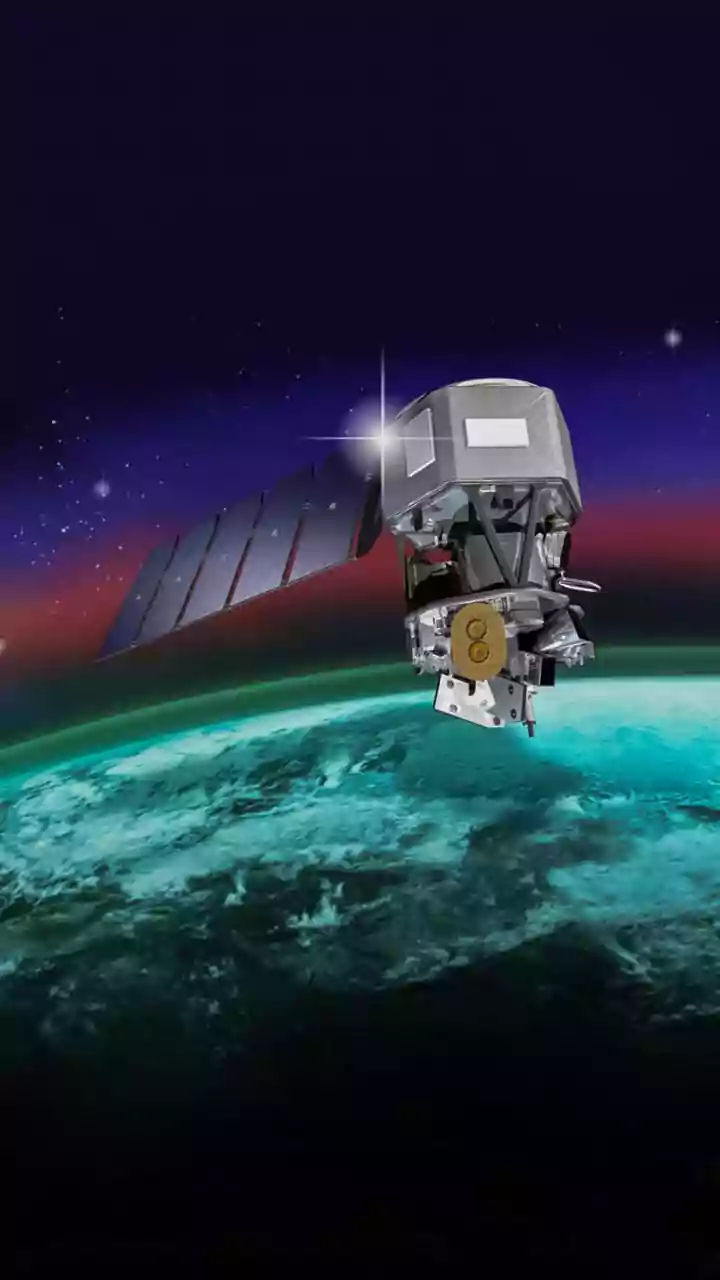
A satellite image is not a simple photograph. Instruments in space capture information across the electromagnetic spectrum, much of which is invisible to the naked eye. Volcanologists use several key types of data. Visible light imagery shows us the shape
and colour of plumes and lava flows. Thermal infrared sensors detect heat, highlighting active vents or underground magma. Other sensors measure the composition of gases like sulphur dioxide (SO2), a key indicator of volcanic activity. Finally, radar satellites can see through clouds and darkness to map changes in the ground itself. Each data type provides a different piece of the puzzle, and none of them alone tells the whole story.
The Ash vs. Cloud Dilemma
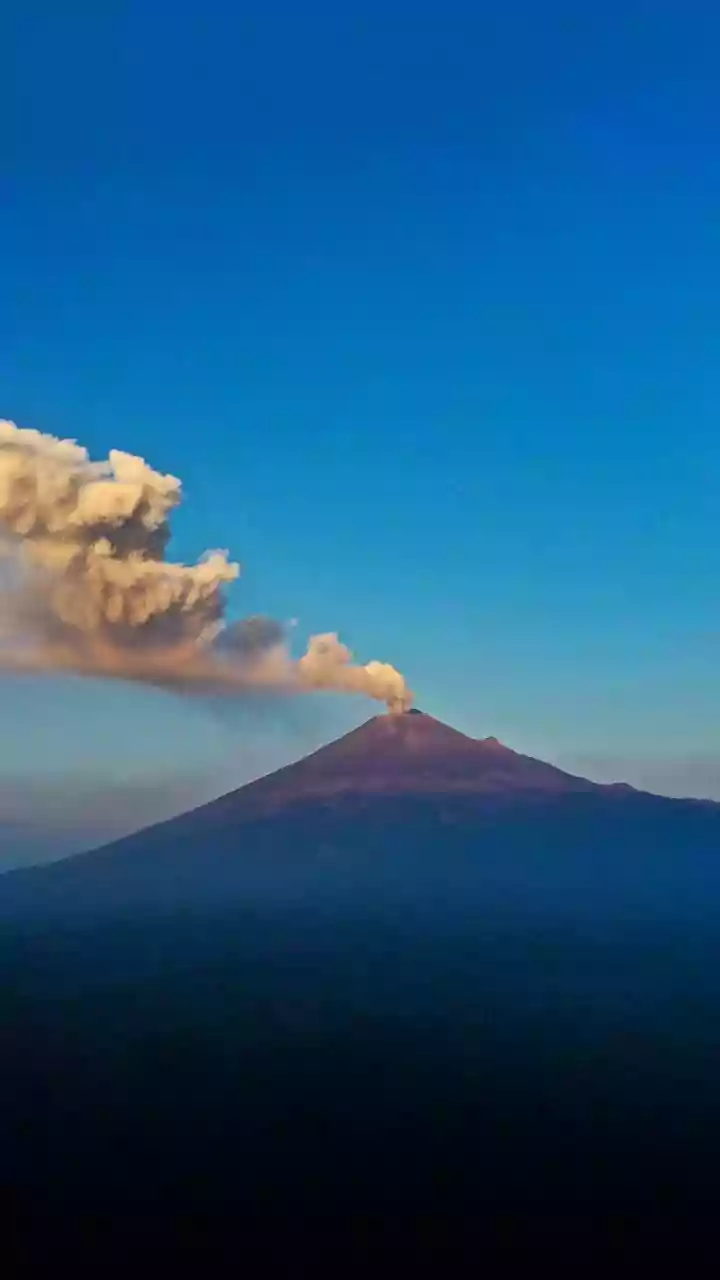
One of the most critical and difficult tasks is distinguishing a volcanic ash cloud from a normal weather cloud. To the untrained eye, they can look identical. However, they have different properties that specialized satellite sensors can detect. Volcanic ash is made of tiny fragments of rock, mineral, and glass, which interact with infrared light differently than the water droplets or ice crystals in meteorological clouds. Experts use a technique that compares the brightness temperature of the cloud at two different infrared wavelengths. For a weather cloud, this difference is usually positive, but for an ash cloud, it's often negative. This distinction is vital, as volcanic ash poses a serious hazard to aircraft, capable of causing engine failure.
Reading the Heat Signature
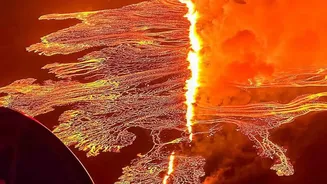
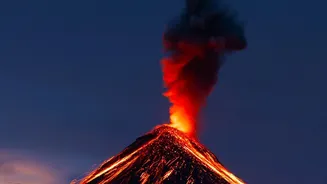
Thermal anomalies, or hotspots, detected by satellites are a major sign of volcanic unrest. Systems like NASA's MODVOLC automatically scan global satellite data for these heat signals, allowing for rapid detection of new activity, often in remote locations. However, a hotspot doesn't automatically mean a full-blown eruption is underway. It could be a persistent lava lake, a field of steaming vents known as fumaroles, or even something non-volcanic like a forest fire. The key for scientists is to look for change over time. A sudden increase in the size or intensity of a thermal anomaly is a much stronger indicator that new magma is nearing or has reached the surface.
Detecting the Ground's Slow Breath
Perhaps one of the most powerful satellite techniques for forecasting an eruption involves something you can't see at all: ground deformation. As magma moves and accumulates beneath a volcano, it can cause the ground surface to swell upwards, like a slowly inflating balloon. A technique called Interferometric Synthetic Aperture Radar (InSAR) uses radar images taken at different times to create a map of this movement with centimetre-scale accuracy. This can reveal signs of unrest long before any eruption begins. For example, InSAR detected a bulge around the Three Sisters volcanoes in Oregon, indicating rising magma. It provides a spatially complete map of deformation, which is a huge advantage over ground-based sensors that only measure change at a few points.
The Indispensable Human Expert
Ultimately, satellites are just tools; they provide data, not answers. The crucial final step is the synthesis and interpretation performed by a team of volcanologists. They combine data from multiple satellites with information from ground-based monitoring networks, which include seismometers to detect earthquakes and sensors to measure gas emissions directly. An expert's interpretation is essential because context is everything. They must consider the volcano’s known history, its unique geology, and whether the satellite data is consistent with other signals. This holistic approach is what transforms raw data into a reliable assessment of volcanic hazards, which is critical for issuing timely and accurate warnings to protect lives and property.