



The Sun’s Restless Heartbeat
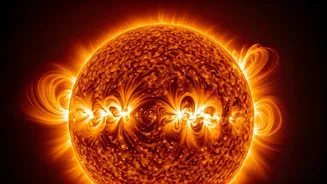
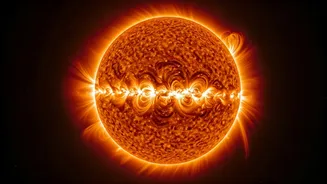
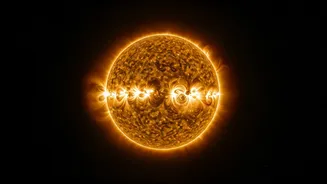
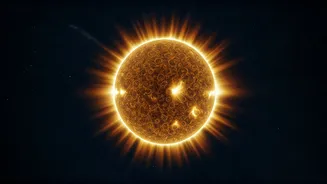
The Sun’s surface is a canvas of immense magnetic activity. At the heart of this activity are sunspots—dark, cooler patches that are the visible signs of intense magnetic fields. These spots are not random; they follow a rhythmic pattern known as the solar
cycle. Approximately every 11 years, the Sun cycles from a period of few sunspots (solar minimum) to a period of many (solar maximum). This cycle is driven by the Sun's own internal magnetic dynamo, which flips the star's magnetic poles every cycle. For centuries, astronomers have tracked these cycles simply by counting the number of visible sunspots, creating a long-term record of solar behaviour. This data, though simple, provides crucial insights into the Sun's long-term variability.
A Breakthrough in Solar History
While we have direct, high-resolution magnetic observations of the Sun from the last 50 years, this is a mere blink in our star's life. To truly understand long-term patterns, scientists needed to see the magnetic maps of the past. A recent breakthrough has made this possible. Researchers have developed new methods, some using AI, to transform simple historical sunspot counts and drawings into dynamic, flowing maps of the Sun's magnetic field. For instance, a team of Indian astronomers used AI to analyse 100 years of hand-drawn sun charts from the Kodaikanal Solar Observatory, turning them into machine-readable data. This allows them to reconstruct the Sun’s magnetic activity with incredible accuracy, stretching back over two centuries and covering 24 complete solar cycles.
Chasing the Grand Solar Minimum
The purpose of this historical reconstruction is to better understand and predict 'solar lulls', more formally known as Grand Solar Minima. These are not your typical 11-year solar minimums but prolonged periods, lasting for decades or even centuries, where solar activity is significantly suppressed. The most famous example is the Maunder Minimum, which occurred between 1645 and 1715. During this 70-year period, sunspots became exceedingly rare. This event coincided with the 'Little Ice Age' in the Northern Hemisphere, a period of bitterly cold winters and cooler summers, suggesting a link between the Sun's long-term activity and Earth's climate.
Potential Impacts on Earth and India
A future Grand Solar Minimum could have widespread consequences. A reduction in solar radiation could lead to a decrease in average global temperatures, though scientists note this effect would be minor compared to the warming from anthropogenic greenhouse gases. However, regional climate patterns could be significantly affected. For India, changes in solar activity could influence the delicate balance of the monsoon system. But the more immediate threat is to our technology. Intense solar activity during a maximum can disrupt satellites, communication networks, and power grids. While a minimum implies less activity, understanding the Sun's cycles is crucial for protecting our increasingly tech-dependent infrastructure. Separately, studies in India have noted a phenomenon of 'solar dimming' where pollution and aerosols reduce the amount of sunlight reaching the surface, impacting agriculture and solar power generation, a problem that could be compounded by natural solar variations.
A Glimpse of the Future
So, are we headed for another deep freeze? Predictions vary. Some models, based on the weakening Solar Cycle 24 and the start of Cycle 25, suggested the Sun was entering a modern Grand Solar Minimum that could last until the 2050s. However, more recent data indicates that Solar Cycle 25 is proving to be more active than initially expected, questioning the likelihood of an imminent deep lull. What these new historical maps provide is a more robust, physically consistent framework for forecasting. By understanding the rules that governed the Sun's past, scientists can build more reliable models to predict its future, turning a cosmic mystery into a set of probabilities we can prepare for.