



Decoding a Staggering Number
A recent international study has provided the most detailed picture yet of polar ice loss, drawing on five decades of satellite data. According to the research, which combined information from 27 different satellite missions, the Greenland and Antarctic
ice sheets collectively lost approximately 11,309 billion metric tonnes of ice between 1979 and 2023. This massive loss of frozen water has contributed about 3.14 centimetres (around 1.2 inches) to the global mean sea level. The study is the result of the Ice Sheet Mass Balance Inter-comparison Exercise (IMBIE), a major scientific collaboration between NASA and the European Space Agency (ESA) designed to reconcile measurements from different satellites and produce a single, reliable estimate of ice sheet change. By extending the record further back in time than previous assessments, scientists have confirmed a worrying acceleration in ice loss, especially since the 1990s.
What Does 11 Trillion Tonnes Look Like?
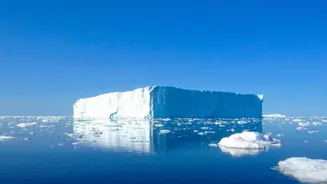
The sheer scale of 11.3 trillion tonnes is difficult to comprehend. To put it in perspective, researchers have offered several striking comparisons. This amount of ice is enough to form a cube measuring 23 kilometres on each side. Another visualisation suggests it would be enough to cover the entire continental United States in about 1.5 metres (5 feet) of ice. For an Indian context, while no direct comparison was provided in the study, the volume of water is immense. This level of melt adds nearly three quadrillion litres of water into the world's oceans. The data shows that the rate of loss has increased dramatically over the decades. In the 1980s, the combined annual loss was around 108 billion tonnes. By the 2010s, that figure had quadrupled, soaring to an average of 466 billion tonnes per year.
A Tale of Two Ice Sheets
The melting is not uniform across the poles. Greenland has been the larger contributor to the ice loss, accounting for roughly 60% of the total, or about 1.8 centimetres of the resulting sea level rise. Antarctica, while holding vastly more ice, accounted for the other 40%, adding about 1.3 centimetres to sea levels. The most alarming finding from the study is not just the amount of melt, but the mechanism behind it. Scientists found that about 84% of the total ice loss was due to 'dynamic' processes—meaning glaciers are flowing faster and discharging more ice directly into the ocean. This is primarily driven by warming ocean waters, which melt the edges of glaciers from below, weakening the ice shelves that hold them back and allowing inland ice to accelerate towards the sea. Only 16% of the loss was attributed to surface melting from warmer air temperatures.
Why This Matters for India's Coastline
A few centimetres of global sea level rise might not sound like much, but it has profound consequences for coastal nations like India. With a coastline spanning approximately 7,500 kilometres and hundreds of millions of people living in low-lying areas, India is highly vulnerable. Major metropolitan hubs such as Mumbai, Kolkata, and Chennai are already facing increased risks. The rise in mean sea level is a primary driver of more frequent and intense coastal flooding. Even a small increase in the baseline sea level allows storm surges to push further inland, causing greater damage. Furthermore, it contributes to coastal erosion, which already affects about a third of India's shoreline, and saltwater intrusion, which contaminates freshwater sources and agricultural land. While local factors play a role, the melting of distant ice sheets is a direct and growing threat to the safety and livelihoods of millions in India. Projections already suggest that sea levels around India's coast could rise by up to a metre by the end of the century.