





What Are Sunspots, Anyway?
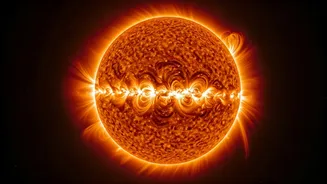
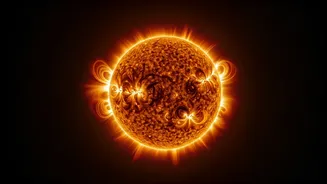
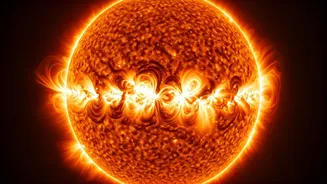
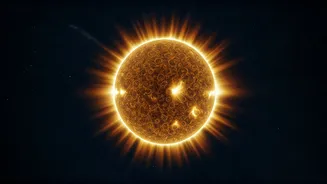
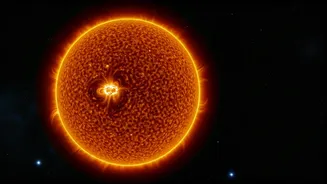
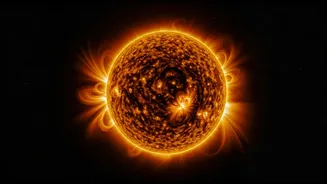
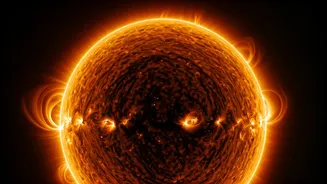
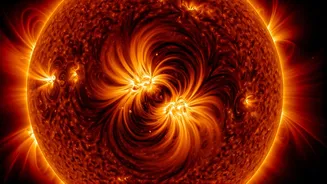
To understand the breakthrough, we first need to talk about sunspots. These are not permanent blemishes but temporary dark patches that appear on the sun's surface, or photosphere. They look dark only because they are cooler than their surroundings, caused
by intense magnetic activity that blocks the upward flow of hot gas from the sun's interior. Sunspots can be enormous, some as large as 50,000 miles in diameter, and they often appear in groups. For centuries, astronomers have known that the number of sunspots waxes and wanes in a roughly 11-year cycle. This rhythm, from a quiet solar minimum to a busy solar maximum and back again, is the sun's most noticeable heartbeat.
Introducing Sporer's Law
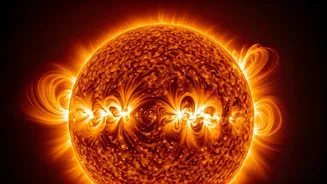
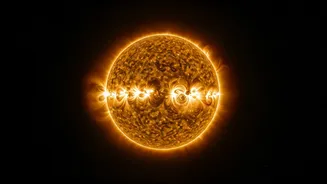
This is where Sporer's Law comes in. It’s an observational rule discovered in the 19th century by astronomers Richard Carrington and Gustav Spörer. They noticed that sunspots don't just appear randomly. At the beginning of a new 11-year solar cycle, sunspots emerge at the sun's higher latitudes, around 30 to 45 degrees north and south of its equator. As the cycle progresses, new sunspots appear progressively closer to the equator. By the time the cycle ends, the spots are forming near the equator, at around 7 degrees latitude, just as the next cycle's high-latitude spots begin to appear. When you plot the latitude of sunspots over time, the pattern looks like a pair of butterfly wings, earning it the nickname the "butterfly diagram."
The Challenge of Ancient Data
Sporer's Law is straightforward when you have modern telescopes and detailed records. But how do you apply it to a time before organised scientific observation? Records of sunspots go back centuries, long before the invention of the telescope. Chinese and Korean astronomers noted them as early as 800 B.C. The first known drawing of a sunspot comes from an English monk, John of Worcester, in 1128. However, these historical records are often sporadic and lack crucial information, particularly the latitude where the spot appeared. This makes it incredibly difficult to reconstruct past solar cycles with any precision. Scientists knew the spots were there, but couldn't place them on the solar 'map' to see the butterfly pattern.
A New Historical Detective Tool
The latest research tackles this very problem. By combining historical drawings and written descriptions with modern understanding of solar physics, scientists can now make educated inferences about the latitude of these ancient spots. For example, the apparent speed and path a sunspot takes across the sun's disk, as described in old texts, can provide clues to its latitude. By cross-referencing these sparse data points with Sporer's Law, they can start to assign probable latitudes to historical observations. This allows them to effectively 'place' an ancient sunspot on the butterfly diagram, determining whether it likely belonged to the beginning, middle, or end of a solar cycle. This technique retroactively fills in the gaps in our historical solar records, turning fragmented anecdotes into valuable scientific data.
Why This Cosmic Archaeology Matters
Tracking ancient sunspots is more than just an academic exercise. Understanding the sun's long-term behaviour, including periods of unusual activity like the Maunder Minimum (a period of very few sunspots in the 17th century), is crucial for several reasons. A more complete history of solar cycles helps scientists refine their models of the solar dynamo—the internal mechanism that generates the sun's magnetic field. This, in turn, improves our ability to predict future solar cycles and 'space weather' events like solar flares and coronal mass ejections. These events can disrupt satellites, power grids, and GPS communications, making accurate forecasting essential for our technology-dependent world.