


Thermal Sensors: Seeing the Heat
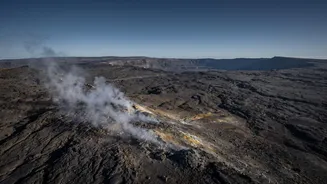
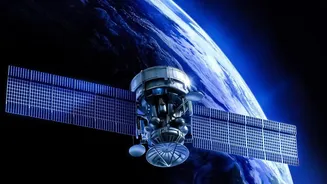
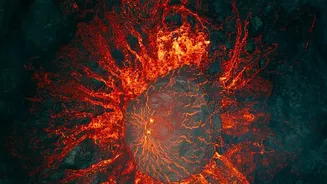
One of the most direct signs of volcanic unrest is heat. Thermal infrared sensors on satellites are designed to detect temperature changes on the Earth's surface. They can spot thermal anomalies, or 'hot spots', that might signal magma moving closer to the surface,
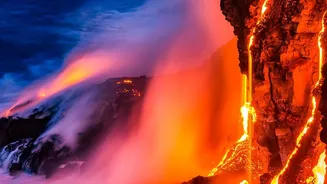
the formation of a new lava dome, or the flow of lava itself. Think of it as a celestial thermometer that can scan vast, remote areas. Instruments like MODIS (Moderate Resolution Imaging Spectroradiometer) and ASTER (Advanced Spaceborne Thermal Emission and Reflection Radiometer) constantly monitor for these changes. While some sensors provide frequent, broad views, others like ASTER can offer more detailed, higher-resolution thermal images, helping scientists analyze the structure and temperature of lava flows with greater precision.
Radar Sensors: Feeling the Ground Swell
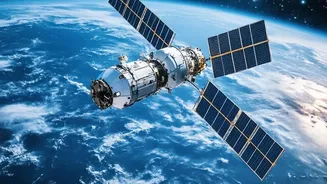
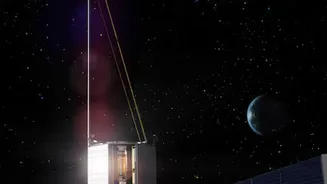
Before an eruption, the ground on and around a volcano can swell, sink, or tilt as magma moves beneath it. This deformation is often subtle, happening on a scale of centimeters, but it’s a critical clue for eruption forecasting. This is where radar satellites excel. Using a technique called Interferometric Synthetic Aperture Radar (InSAR), satellites send radar waves to the ground and measure the return signal. By comparing two images taken at different times, scientists can create a detailed map of ground movement with millimeter-to-centimeter accuracy. A huge advantage of radar is its ability to 'see' through clouds and darkness, which often obscure volcanoes during a crisis. This provides an uninterrupted view of the volcano's changing shape, essentially allowing scientists to see it 'breathe'.
Spectrometers: Sniffing the Gases
Volcanoes exhale gases, and the type and amount can indicate what's happening deep inside. A significant increase in sulfur dioxide (SO2) is a classic indicator that fresh magma is rising. Specialized instruments on satellites, called spectrometers, are designed to 'sniff' these gases from orbit. They work by measuring how gases in the atmosphere absorb specific wavelengths of light. Instruments like the Ozone Monitoring Instrument (OMI) and TROPOMI can map the location and concentration of SO2 plumes as they drift from a volcano. This data is not only vital for forecasting potential eruptions but also for aviation safety, as it helps track the invisible gas clouds that can pose a danger to aircraft.
Optical Sensors: Capturing the Visuals
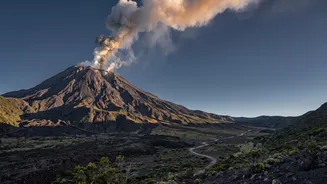
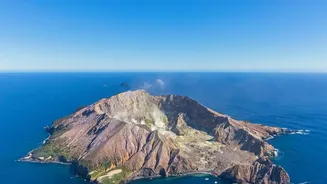
When we think of satellite images, we often picture the high-resolution, true-color photos taken by optical sensors. These function like powerful cameras in space. During an eruption, they are invaluable for tracking the visible ash plumes, which pose a major hazard to air travel. After an eruption, optical images can map the extent of ash deposits, lava flows, and landslides, helping to assess the event's impact. By comparing 'before and after' images, scientists can also document changes to the landscape, like the collapse of a crater or the formation of a new cone. However, optical sensors have one major limitation: they can't see through clouds, which are common around active volcanoes.
A Multi-Sensor Approach: The Full Picture
No single sensor can tell the whole story. The true power of satellite monitoring comes from combining the data from all these different instruments. A thermal sensor might detect a new hot spot, prompting a closer look with high-resolution optical imagery. At the same time, InSAR data could show the ground is inflating, and a spectrometer might pick up a surge in SO2 emissions. This multi-sensor, multi-faceted approach gives volcanologists a more complete and reliable understanding of a volcano's behavior. By integrating these different streams of information, scientists can track activity more accurately, improve eruption forecasts, and ultimately enhance public safety for the millions of people living in the shadow of active volcanoes.