


Visualising an Unthinkable Number
The headline figure of 11,309 billion—or 11.3 trillion—tonnes is difficult to comprehend. To put it in perspective, this is enough ice to cover the entire continental United States in nearly five feet of frozen water. This massive volume of meltwater,
transferred from the polar ice sheets into the world's oceans, has already raised global sea levels by approximately 3.1 centimetres, or about 1.2 inches. While that may not sound like much, for every centimetre of sea level rise, millions more people globally are exposed to the risks of annual coastal flooding. This comprehensive data comes from an international effort that combined information from 27 different satellite missions, creating the most complete picture of polar ice loss to date.
A Tale of Two Poles
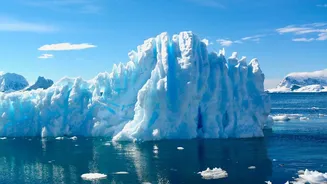
While both poles are losing ice, the story is not uniform. Greenland has been the larger contributor to the total loss, shedding about 6,215 billion tonnes since 1972. In contrast, Antarctica lost around 4,780 billion tonnes since 1979. The primary driver behind this immense loss is not just warmer air melting the ice from above. A striking 84% of the total loss is due to what scientists call 'ice dynamics'. This means that warmer ocean waters are melting glaciers from below, causing them to speed up and discharge more ice directly into the sea. In Antarctica, this dynamic is responsible for virtually all of the net ice loss, particularly in West Antarctica where major glaciers like Pine Island and Thwaites are accelerating.
Understanding the 'Limits'
The headline's mention of "important limits" refers to several critical scientific concepts. One aspect is the idea of 'tipping points'—thresholds beyond which changes can become large-scale and irreversible. Scientists believe some systems, like the West Antarctic Ice Sheet, may be approaching or have already passed such a point, committing us to future sea-level rise even if warming were to stop today. However, other massive stores of ice, like the much larger East Antarctic Ice Sheet, are considered more stable and would require significantly more warming to be threatened. The 'limits' also refer to temporary fluctuations in the data. For instance, a recent slowdown in the rate of ice loss between 2020 and 2023 was noted, but this was attributed to short-term weather patterns, like unusually high snowfall in East Antarctica, not a reversal of the long-term trend.
The Acceleration and What It Means
The long-term record shows a clear and worrying acceleration. Both ice sheets were in a state of relative balance in the 1970s. From the 1990s onward, the rate of loss began to climb steeply. For Greenland, the annual loss rate increased more than fourfold from the 1980s to the 2010s. A similar acceleration was observed in Antarctica. This trend underscores that the melting of our polar regions is not a slow, linear process but one that is gathering pace. This has profound implications, as the ice sheets are now responsible for about a quarter of all global sea-level rise. This influx of cold freshwater can also impact ocean circulation patterns, which play a crucial role in regulating global climate.