

/images/ppid_a911dc6a-image-177083556748629873.webp)
/images/ppid_a911dc6a-image-177083563836656334.webp)
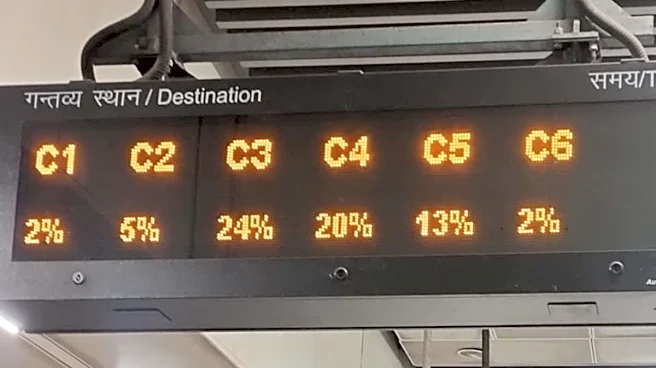
Delhi Metro is the lifeline of the national capital. Carrying millions of passengers weekly, the Delhi Metro’s world-class infrastructure and on-time budget travel ease the lives of commuters, helping them avoid traffic jams and polluted air in the city. However, a commuter who was recently waiting at the Metro station to catch the train posed a question to the Reddit community, asking if they could make sense of the display screen showing letters and corresponding percentages at the stop.
“I’ve always wondered what do these letters and the percentages below mean,” the user asked.
Percentage Display
Considered a useful tool for daily passengers who wish to occupy an empty coach, possibly hoping to get a seat, the platform display (in orange/yellow font) helps not
only gauge the occupancy of coaches but also determine the passenger’s mood for the rest of the day.
A commuter may see numbers such as these: 8%, 29%, 55%.
The percentage denotes the capacity of individual coaches at which they are running. Higher the percentage, the higher the occupancy. For example, C5 displaying 100% means the fifth coach from the first car is running at its full capacity.
This helps passengers avoid the occupied coach and approach the car displaying a lower percentage.
The Gaussian or Normal Distribution
How does the coach know what percentage of it is occupied? According to the Reddit community, Delhi Metro incorporates the Gaussian distribution.
“A Gaussian distribution, also known as a normal distribution, is a continuous probability distribution characterized by its bell-shaped curve. It is defined by two parameters:
μ (mu): The mean or expected value of the distribution
σ (sigma): The standard deviation, which measures the spread of the distribution,” noted Data Camp.
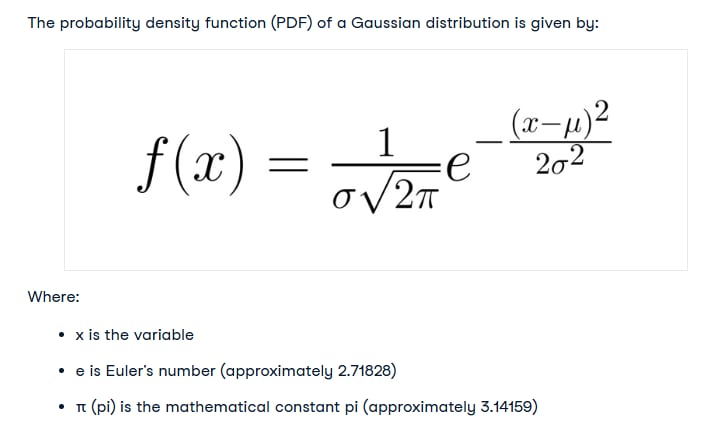
(Data Camp)
This percentage, called the Passenger Load Percentage, is calculated based on the weight distribution of passengers across the coaches. The weight sensors built into the wheel assemblies calculate the weight of each coach, thus determining the passenger percentage that is then displayed on the screen.
The percentage display gives one an idea whether they would want to board the upcoming train or have buffer time to skip the stuffy coaches.
Explaining the display in layman’s terms, a user typed: “This shows the percentage of actual weight capacity already filled in each coach. C1 refers to the first coach in the moving direction and C6 is the last coach. This is to give an idea to the people on the station regarding which coaches are less crowded(one with less percentage) so that they have hassle-free journey. It also ensures overall weight distribution in the train for safer journey.”
Helpful But Not Always Accurate
Several Delhi Metro commuters also stated that the feature, although handy, wasn’t always accurate according to their experiences.
“Coach occupancy percentages. Higher the percentage => lesser are your chances of finding the seat In the respective coach. Although not very accurate at times, for reasons like unequal weight/load distribution, additional luggage/cargo etc (sic),” wrote one user on Reddit in a conversation dedicated to the functioning of these platform displays.
“I feel it’s not very accurate. Last friday, I boarded second last coach that showed 1% but it was almost full not packed but full (sic),” rued one commuter.
“Coaching occupancy according to weight limits, seats get full around 20 percentage tho (sic),” noted another.


/images/ppid_a911dc6a-image-177084257810510483.webp)

/images/ppid_a911dc6a-image-177084253417916956.webp)

/images/ppid_59c68470-image-177084004043125742.webp)

/images/ppid_a911dc6a-image-177083903258342419.webp)