
What's Happening?
A new comprehensive online resource, the THB Global Extreme Weather and Climate Change Dashboard, has been launched. This dashboard provides extensive information, data, analyses, and graphs related to
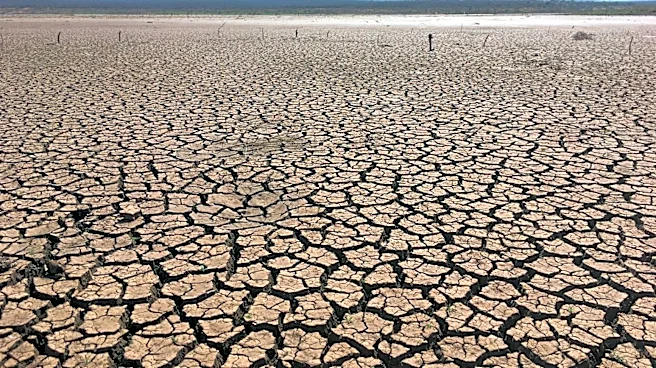
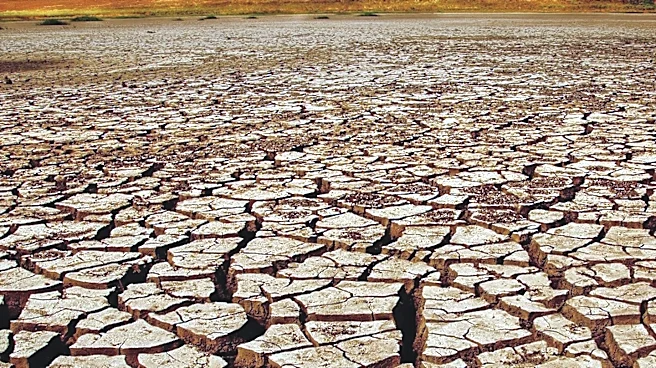
global extreme weather and climate phenomena. It encompasses 288 indicators derived from 57 variables across eight phenomena, covering the entire world and every continent. The dashboard applies the Intergovernmental Panel on Climate Change (IPCC)'s detection framework globally, using a consistent statistical standard across phenomena such as tropical cyclones, extratropical cyclones, extreme heat, cold spells & frost, river flooding, drought, and wildfire. These phenomena are identified as responsible for nearly all of the human and economic toll of weather and climate, accounting for 99.7% of global weather/climate-related economic losses and 97.7% of weather/climate-related deaths.
Why It's Important?
The launch of the THB Global Extreme Weather and Climate Change Dashboard is significant because it fills a critical gap in publicly available climate hazard tools. Unlike most existing resources that focus on a single phenomenon or country, this dashboard offers a broad, global, and IPCC-aligned trend-detection system across an entire set of hazards. This comprehensive approach provides a unified standard for understanding the impacts of extreme weather and climate events, which are major drivers of human and economic losses worldwide. For policymakers, researchers, and the public, this tool offers a more complete picture of climate-related risks, enabling better-informed decisions regarding disaster preparedness, climate adaptation strategies, and resource allocation. The consistent methodology allows for more accurate comparisons and assessments of climate trends globally.
What's Next?
The THB Global Extreme Weather and Climate Change Dashboard is described as a work in progress, indicating that further improvements and additions are anticipated. Users are encouraged to explore the site and provide feedback to help refine its features and content. The creators also mention that much more is in the works, suggesting ongoing development and expansion of the dashboard's capabilities and data sets. This continuous development will likely involve incorporating new research, updating data, and potentially adding more indicators or phenomena. The dashboard's success will depend on its ability to remain current, accessible, and responsive to the evolving needs of the climate science and policy communities.
Beyond the Headlines
The creation of the THB Global Extreme Weather and Climate Change Dashboard highlights a growing demand for integrated and standardized data in the field of climate science. By applying the IPCC's detection framework globally, the dashboard contributes to a more unified understanding of climate change impacts, moving beyond fragmented regional or phenomenon-specific analyses. This initiative could foster greater international collaboration in climate research and policy development, as it provides a common reference point for discussing and addressing global climate challenges. The emphasis on the human and economic toll of extreme weather events also underscores the urgent need for effective climate action and resilience-building strategies, making the data provided by such dashboards crucial for informing public discourse and policy debates on climate change.